We define a bullish divergence in momentum by either a market’s recovery above a prior corrective high or a market’s recovery above an initial counter-trend high. Either definition breaks the downtrend and exposes at least an interim trend the other way with the important by-product being the market’s rejection and definition of a more reliable low and support from which the risk of non-bearish decisions can only then be objectively based and managed.
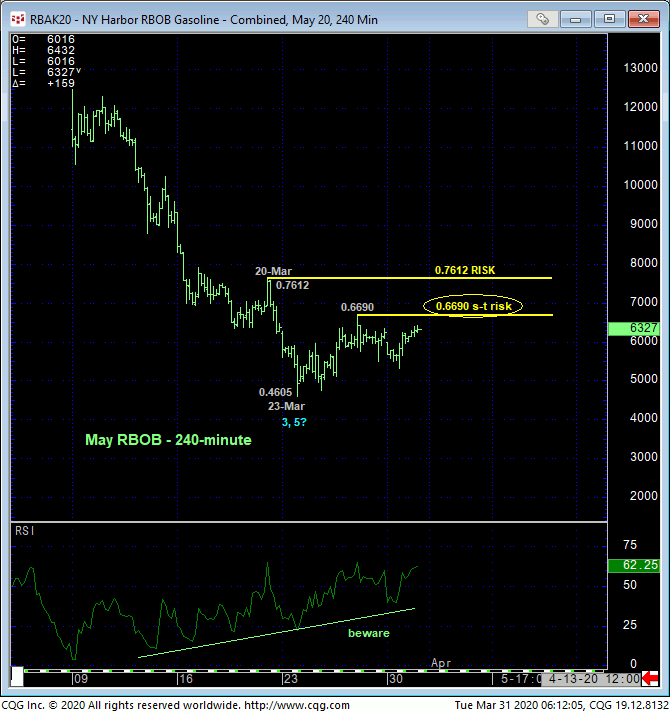
This RBOB market has satisfied neither requirement, yet. But looking at the 240-min chart below, it has quietly provided price action that ISN’T the bludgeoning downtrend that unfolded unabated from 20-Feb’s 1.7946 high. Moreover, last Thur’s 0.6690 high would be an initial counter-trend high, the break above which would confirm a bullish divergence in momentum that would at least interrupt the major bear trend. But for ancillary reasons discussed below, such admittedly minor strength above 0.6690 should not be ignored as an early indication of a more protracted base/reversal process.


Contributing to a base/reversal threat are:
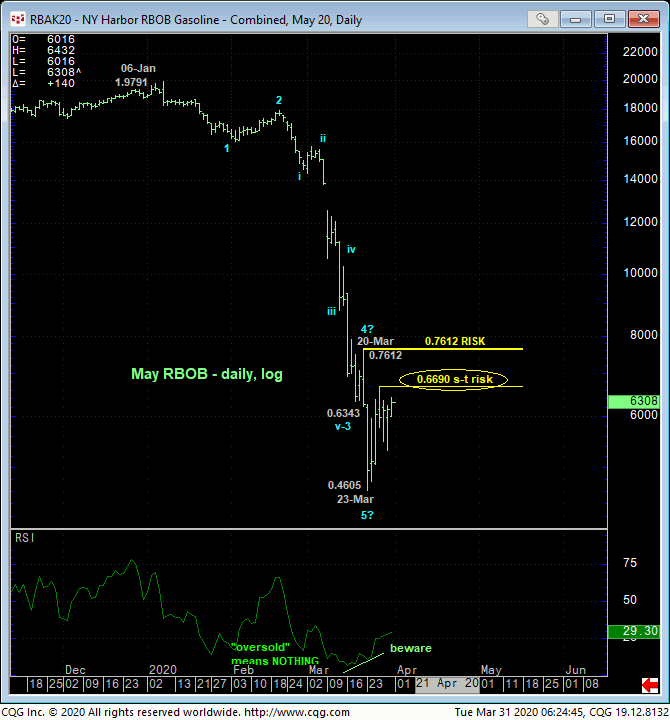
- waning downside momentum on a daily basis above
- the prospect that the entire collapse from 06-Jan’s 1.9791 high is a complete 5-wave Elliott sequence as labeled above and
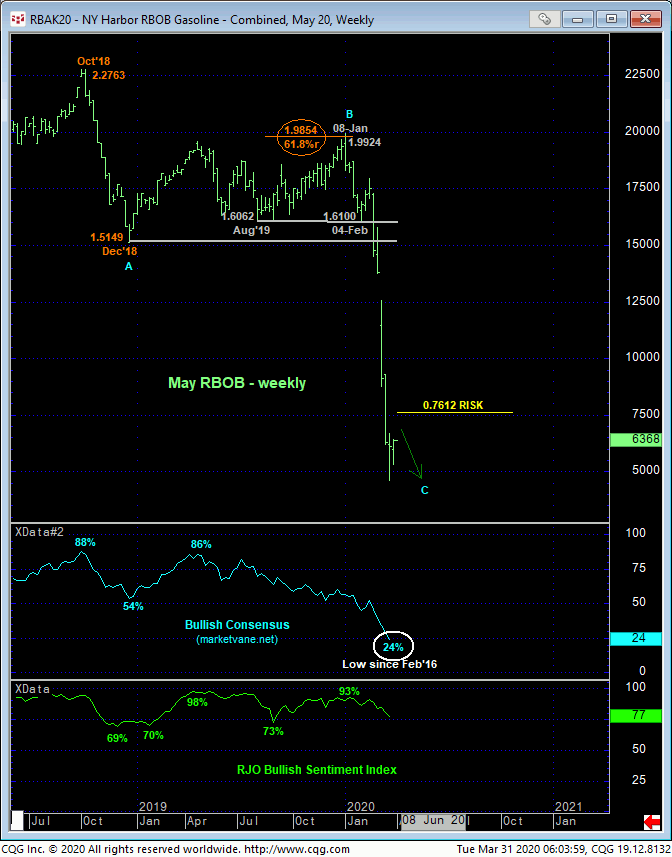
- historically bearish levels in the Bullish Consensus (marketvane.net) not seen in FOUR YEARS.
Granted, none of these factors mean anything until and unless the market breaks the clear and present and major downtrend. 20-Mar’s 0.7612 high is the next larger-degree corrective high and key risk parameter this market is required to recoup to really break the bear and confirm a major correction or reversal higher. But that momentum divergence has got to go through last week’s admittedly minor 0.6690 initial counter-trend high.

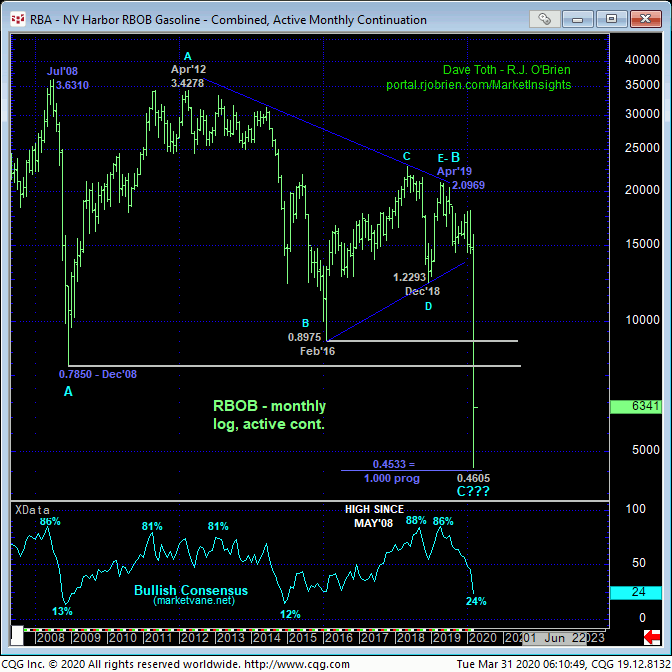
Finally and while it’s not hard to challenge pretty much any wave count anyone musters up, it is kind of interesting to consider the prospect that all of the price action from Dec’08’s 0.7850 low to Apr’19’s 2.0969 high could be that of a massive B-Wave triangle as labeled in the monthly log scale chart below. Regardless of whether this count meets with anyone’s approval or not, it’s interesting that the plunge from that 2.0969 high has thus far come within 0.7-cents of equaling (i.e. 1.000 progression) 2008’s meltdown from 3.6310 to 0.7850. Would we bet the farm on this Fibonacci fact that the market has bottomed? Of course not. But COMBINED with the facts and factors mentioned above and reinforced by a recovery above 0.6690 initially and then 0.7612, and this ancillary factor contributes to the case.
In sum, the market has yet to provide the evidence necessary to suggest the collapse has ended. But admittedly short-term strength above 0.6690 would define/reject enough of a low at 0.4605 to move to a cautious bullish stance ahead of a correction or reversal higher that could be major in scope. reinforcing evidence would come on larger-degree strength above 0.7612.


