Posted on Jul 27, 2023, 08:13 by Dave Toth
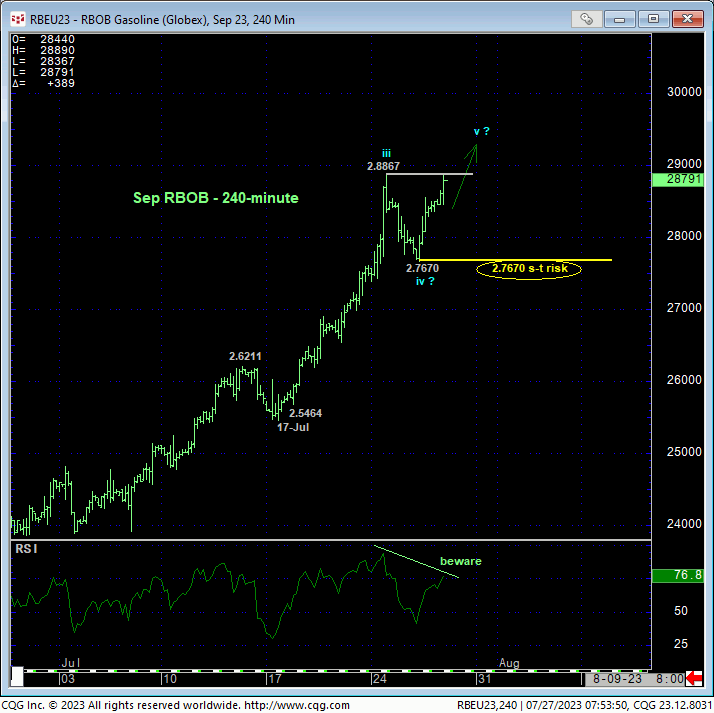
While the market only poked above Mon’s 2.8867 high briefly this morning, that poke reaffirms the developing uptrend and leaves yesterday’s 2.7670 low in its wake as the latest smaller-degree corrective low this market is now minimally required to fail below to confirm a bearish divergence in momentum, arrest the uptrend and expose at east an interim corrective setback of indeterminable scope. Per such, this 2.7670 low is considered our new short-term but potentially key parameter from which traders are advised to rebase and manage the risk of a bullish policy and exposure.


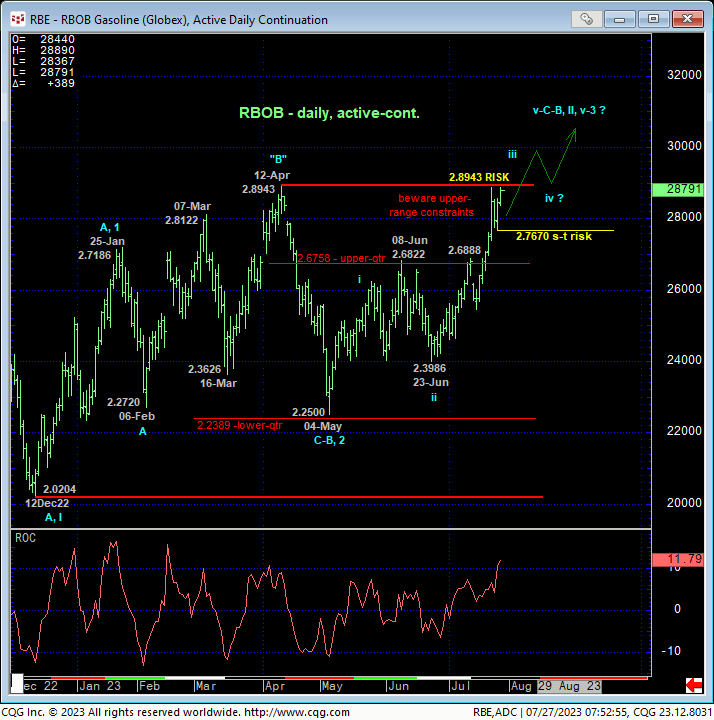
The potentially crucial importance of even an admittedly very short-term corrective low and risk parameter like 2.7670 stems from the market’s current proximity to the extreme upper recesses of a lateral range that has dominated it since last Sep. If there’s a time and place for a market to fail miserably, it is from such upper-range constraints. NO, we would not be able to conclude a more protracted correction or reversal lower from such a smaller-degree mo failure below 2.7670, but the risk/reward metrics of a continued bullish policy following such a failure would become questionable enough for traders to pare or neutralize exposure.
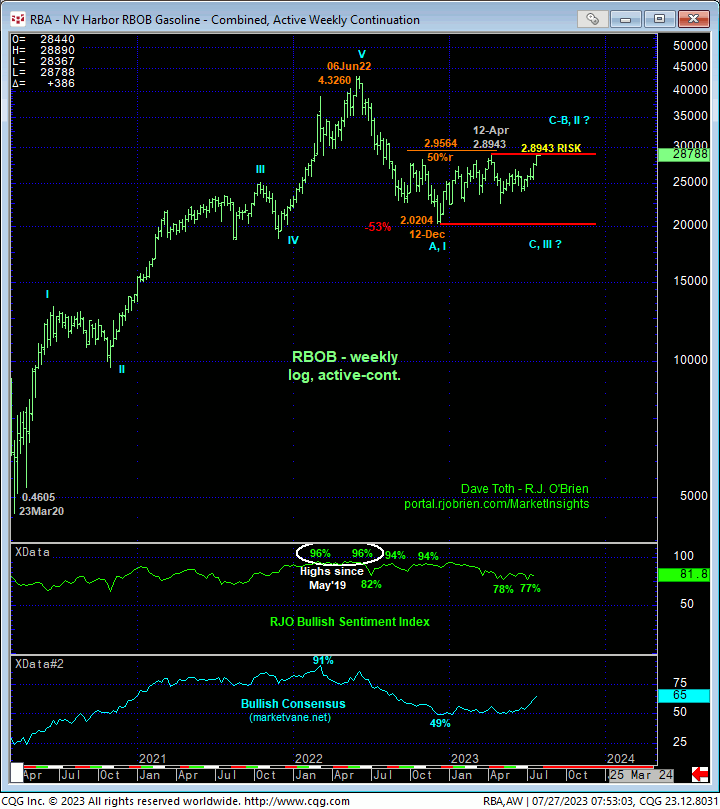
This said, both the daily active-continuation chart above and weekly log chart below show this market just spittin’ distance away from taking out the 2.8943 cap to the multi-quarter range, reaffirming the uptrend from Dec’s 2.0204 low and exposing a vast area totally devoid of any technical levels of merits shy of last year’s 4.3260 all-time high. This doesn’t mean we’re forecasting a move to 4.32 if the market takes out 2.8943, but it certainly does mean that the market’s upside potential above 2.8943 is indeterminable and potentially extreme.

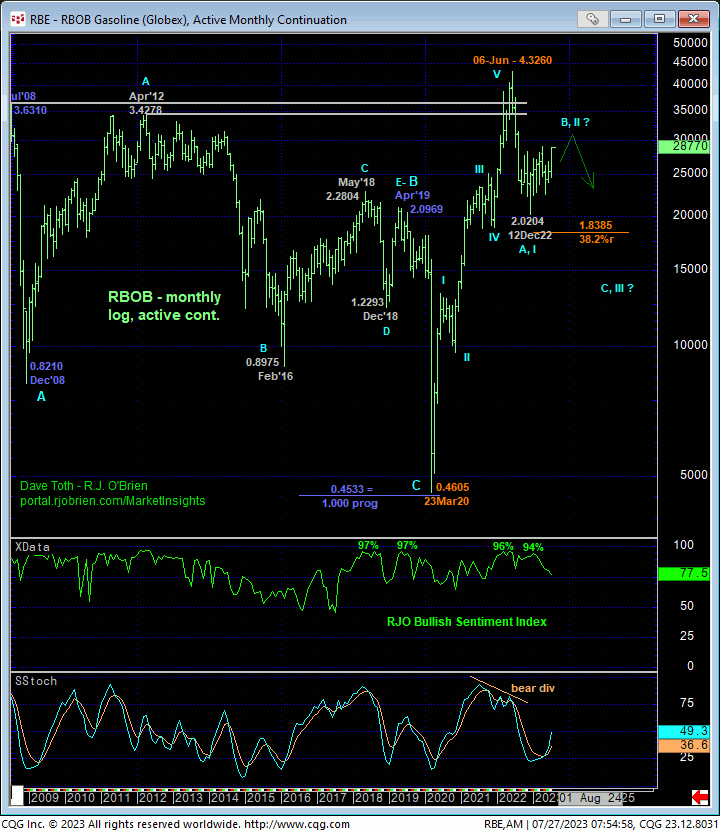
Even if the market does take out Apr’s 2.8943 high and given that even then the market would still be below the 50% retrace of last year’s major and impulsive swoon from 4.3260 to 2.0204, the entire recovery attempt from dec’s 2.0204 low still falls well within the bounds of a mere correction within a new secular move lower. Longer-term traders are reminded that this market is coming off a combination of:
- a bearish divergence in monthly momentum amidst
- historically stratospheric sentiment/contrary opinion levels, and
- a textbook complete and massive 5-wave Elliott sequence up from Mar’20’s 0.4605 low.
Above 2.8943, there is no way to know the market’s upside potential. And we won’t underestimate that potential until arrested by a countering bearish divergence in mo. But against this multi-quarter peak/reversal process, such 2.8943+ levels would still be approached as a (B- or 2nd-Wave) correction ahead of an eventual resumption of the new secular bear trend until negated by a recovery above 2022’s 4.3260 high.
These issues considered, a bullish policy and exposure remain advised with a failure below 2.7670 required to defer or threaten this call enough to warrant moving to a neutral/sideline position to circumvent the depths unknown of a correction or reversal lower. In lieu of such weakness and especially following a break above Apr’s 2.8943 high, further and possibly protracted gains should not surprise.


