

by Dave Toth
Overnight’s break above Mon’s 3.8312 high in the Jun contract AND 07-Mar’s 3.8904 high in the then-prompt Apr contract reaffirms and reinstates the secular bull trend. On a short-term basis detailed in the 240-min chart below, this latest spate of strength identifies Tue’s 3.5025 low as the latest smaller-degree corrective low this market is now minimally required to fail below to confirm a bearish divergence in daily momentum and defer or threaten the bull. Per such, 3.5025 is considered our new short-term risk parameter from which shorter-term traders with tight risk profiles can objectively rebase and manage the risk of a still-advised bullish policy and exposure.
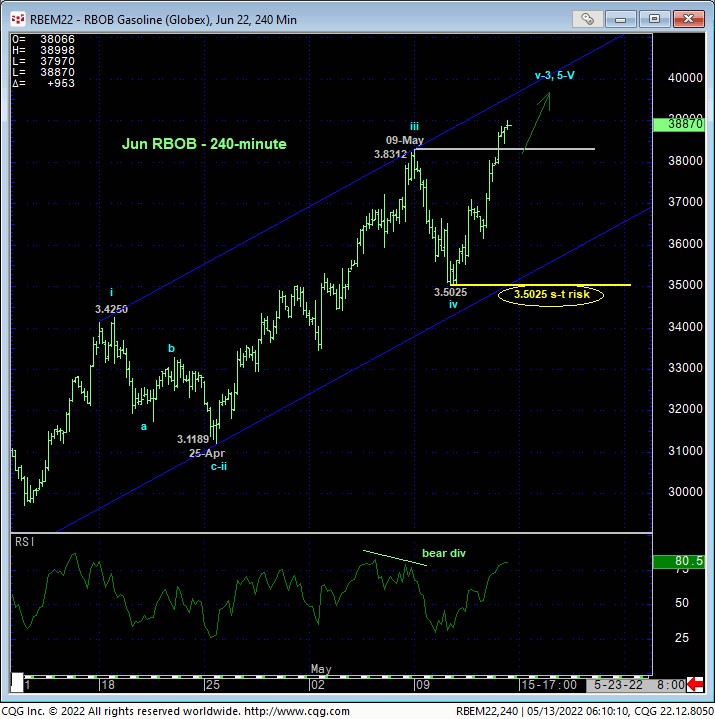
The daily log active-continuation chart above shows today’s resumption of the secular bull market as well as the developing potential for a bearish divergence in momentum. A failure below 3.5025 is required to CONFIRM this divergence to the point of non-bullish action like long-covers. In lieu of such weakness, the trend is up on all scales and should not surprise by its continuance or acceleration straight away.
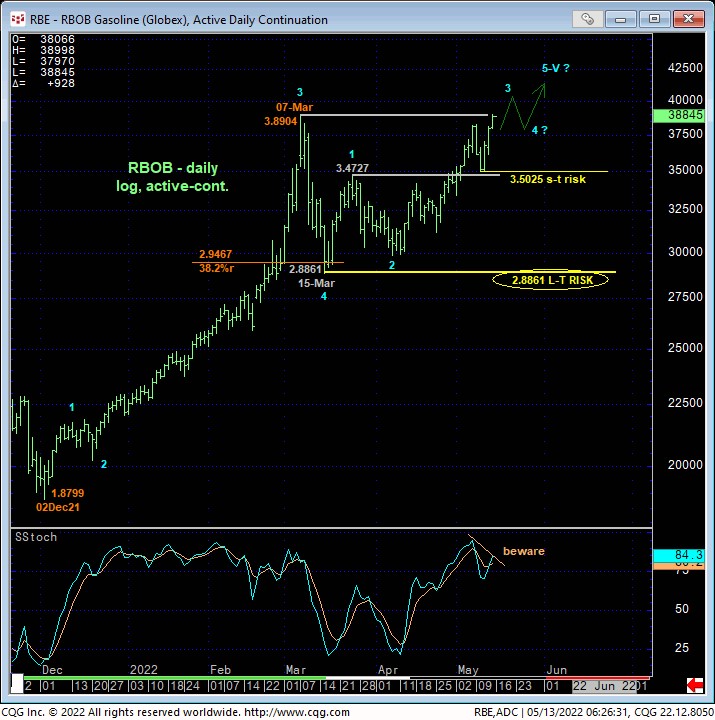
While commensurately larger-degree weakness below 15-Mar’s 2.8861 larger-degree corrective low is required to break the portion of the secular bull from last Dec’s 1.8799 low on an active-continuation basis, it’s interesting to note 25-Mar’s 3.3670 high close of just the Jun contract shown below. This 3.3670 high is arguably the end of the 1st-Wave of the resumed secular bull from 16-Mar’s 2.8769 low close and a level the market should not be able to even come close to, let alone break, in order to maintain the impulsive integrity of a broader and more immediate bullish count. Per such, we believe this 3.3670 threshold serves as a tighter yet objective longer-term bull risk parameter for longer-term commercial players.
This said and as the market gets closer to its inevitable top with each passing day and continued rally, traders are urged to acknowledge and prepare for increased volatility and more “2-steps-up-1-step-back-down” price action in the weeks ahead as part of the slowdown process that typically precedes the ends of such major bull markets. A quick review of the increasingly labored price action in the S&P 500 Index during Nov-Dec-Jan that warned of and preceded it’s major top will provide some insight on what to expect before this RBOB market invariably posts a major top.
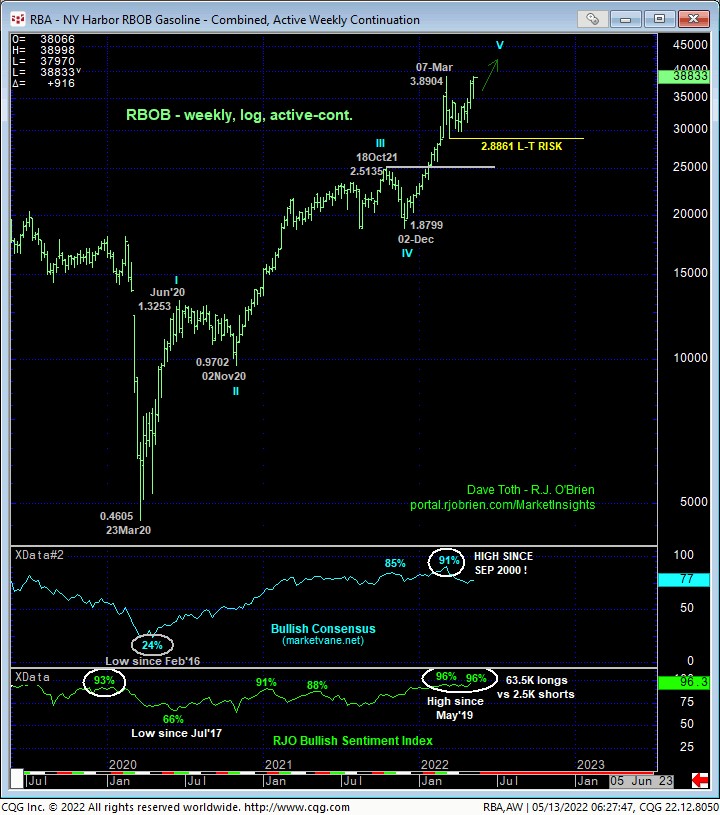

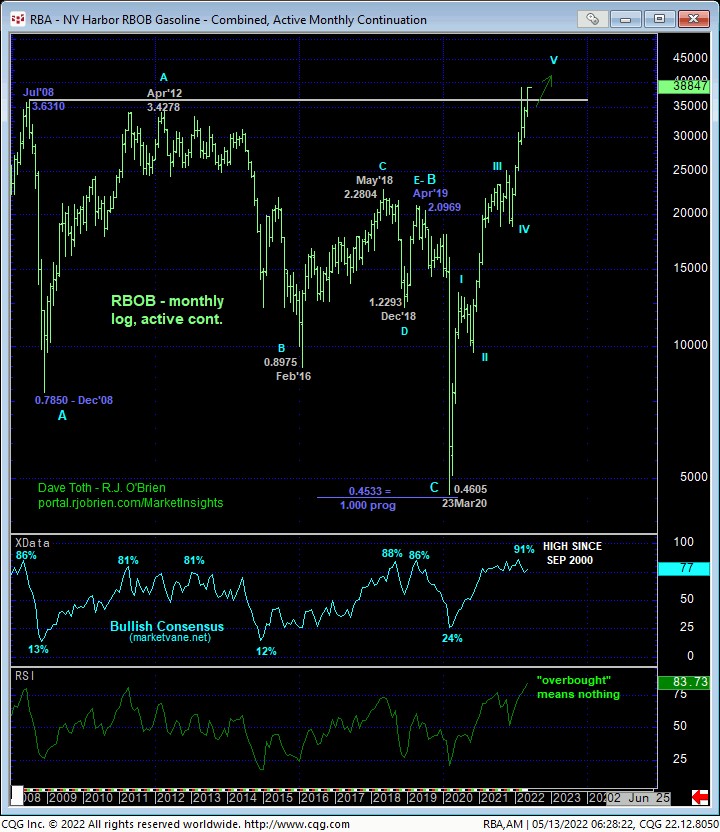
On an even broader scale, the weekly (above) and monthly (below) log scale charts show the magnitude of the secular bull trend to new all-times highs. Understandably historically frothy sentiment/contrary opinion levels are typical of major peak/reversal environments, but traders are reminded that sentiment/contrary opinion is not an applicable technical tool in the absence of an accompanying confirmed bearish divergence in momentum of a scale sufficient to at least threaten the secular bull. Herein lies the importance of our specified risk parameters at 3.3670 and certainly 2.8861.
These issues considered, a bullish policy and exposure remain advised with an intra-day failure below 3.5025 and/or a close below 3.5415 required for shorter-term traders to move to a neutral/sideline position. A close below 3.3670 is required for longer-term commercial players to follow suit. In lieu of such weakness, further and possibly accelerated gains straight away are anticipated.
DISCLAIMER:
The risk of loss in trading futures and/or options is substantial and each investor and/or trader must consider whether this is a suitable investment. Past performance, whether actual or indicated by simulated historical tests of strategies, is not indicative of future results.