APR RBOB
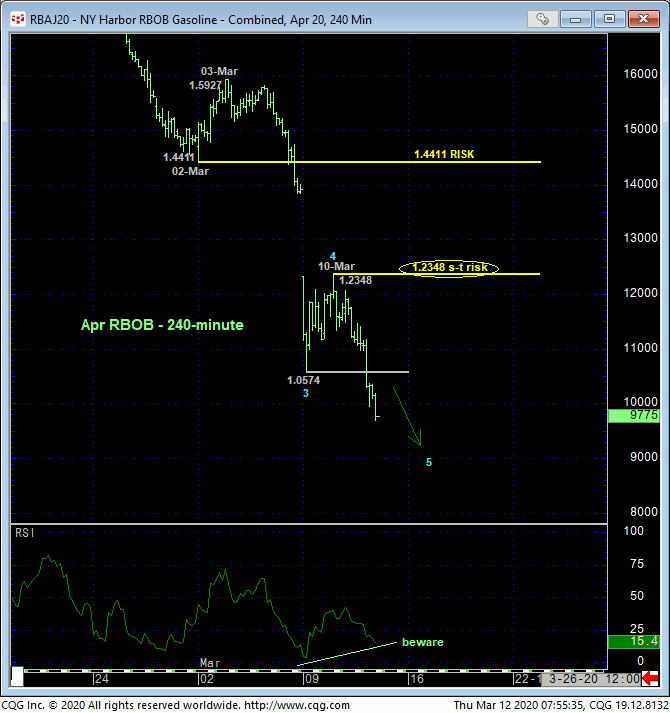
Overnight’s break below Mon’s 1.0574 low reaffirms the major bear trend and leaves Tue’s 1.2348 high in its wake as the latest smaller-degree corrective high this market is now minimally required to recoup to even defer, let alone threaten the bear. Per such, this 1.2348 high serves as our new short-term but key risk parameter from which a bearish policy and exposure can be objectively rebased and managed.
Former 1.06-to-1.10-handle-area support is considered new near-term resistance.
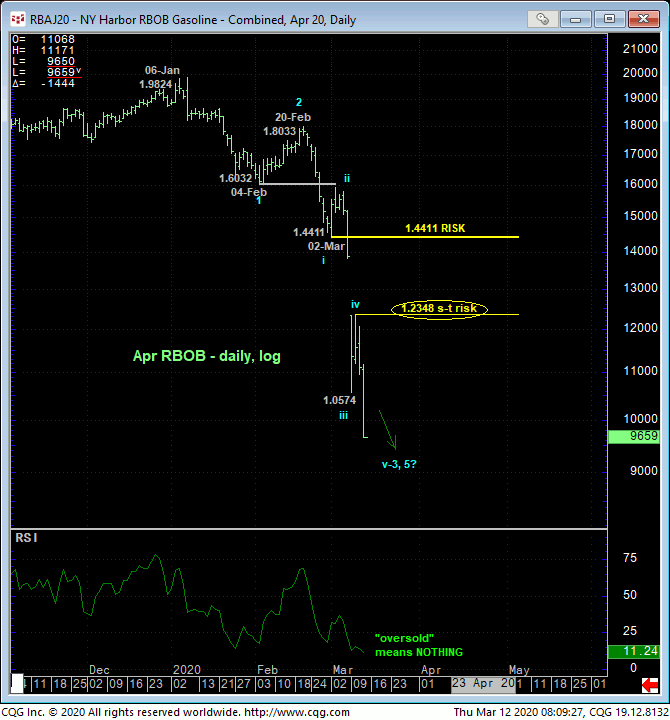
The major downtrend is crystal clear in the daily log scale chart below as is the forever-and-always total uselessness and erroneous suggestion that a market is “overdone” or “oversold” simply because a momentum measure like the RSI has reached some predetermined “low” level. Ridiculous.
What doers matter with the key technical tool of momentum is proof of “non-weakness” by a recovery above a specific and objective corrective high like 1.2348.
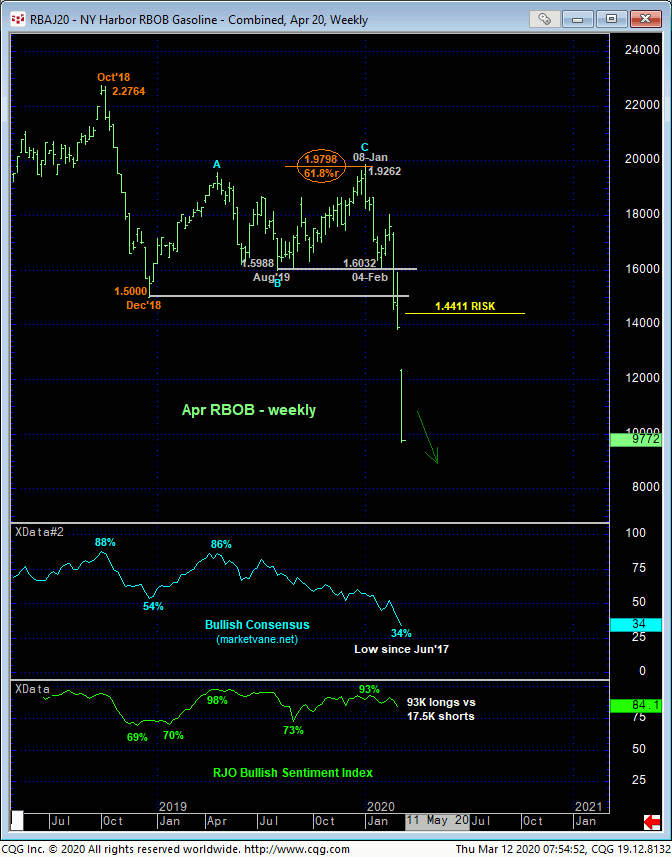
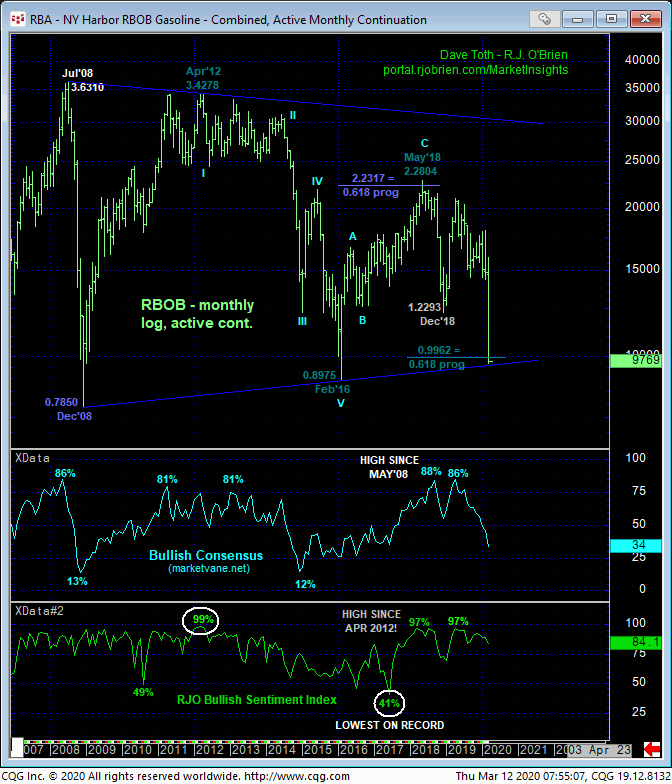
The weekly chart below shows understandably historically bearish levels of market sentiment typical of major BASE/reversal environments. And we have NO DOUBT at all that the extremes to which sentiment/contrary opinion have fallen will eventually play an integral part in the successful navigation of the end to this bear and a major buying opportunity. But traders are reminded that sentiment is not an applicable technical tool in the absence of a confirmed bullish divergence in momentum. Herein lies the extreme importance of even an admittedly short-term mo failure above a level like 1.2348.
The historical monthly log scale chart below shows the market’s engagement of the extreme lower recesses of its massive lateral range that has constrained it over the past 12 years. We place NO reliability on the “derived” uptrend line connecting the 2008 and 2016 lows. Nor on the (0.9962) 0.618 progression of 2012-16’s previous 3.4278 – 0.8975 decline from May’18’s 2.2804 high. But it is interesting to note that this same intra-triangle Fibonacci progression application stemmed 2016-18’s rally at 2.2804 when the 0.618 progression of 2008 – 2012’s 0.7850 – 3.4278 rally taken from Feb’16’s 0.8975 low projected to 2.2317.
We NEVER rely on such derived levels as trend lines, imokus, Bollinger Bands and the ever-useless moving averages unless accompanied by a confirmed bullish (in this case) divergence in momentum needed to, in fact, stem the clear and present downtrend. Herein lies the crucial importance of Tue’s 1.2348 corrective high and risk parameter.
These issues considered, a bearish policy and exposure remain advised with a recovery above 1.2348 required to threaten this call enough to warrant its cover. Until and unless such strength is proven, the trend remains down on all scales and should not surprise by its continuance or acceleration.
APR HEATING OIL
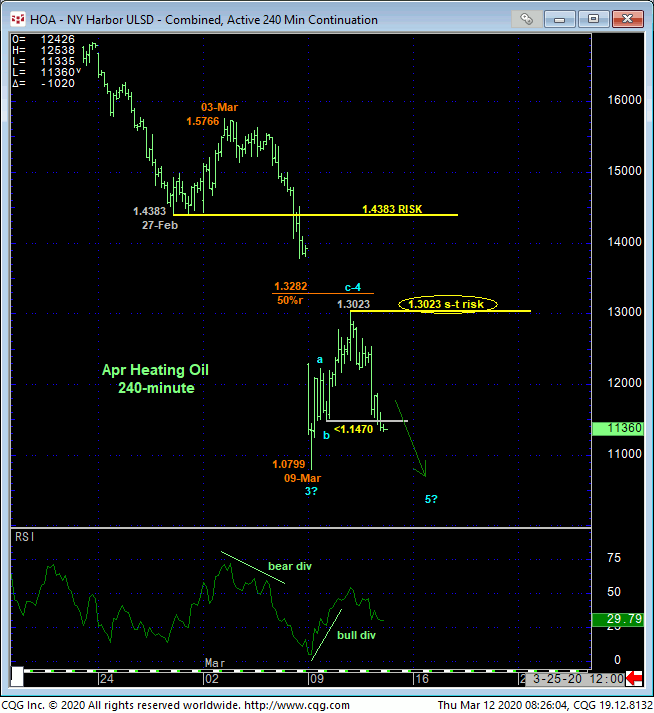
Overnight’s relapse below Mon afternoon’s 1.1470 low renders this week’s recovery attempt a 3-wave and thus corrective affair consistent with the major bear trend that looks poised to resume to new lows below 1.0799 just like RBOB did above. Yesterday’s 1.3023 high is left in the wake of this relapse and the end or upper boundary to this correction and our new short-term risk parameter from which a resumed bearish policy and exposure can be objectively rebased and managed.
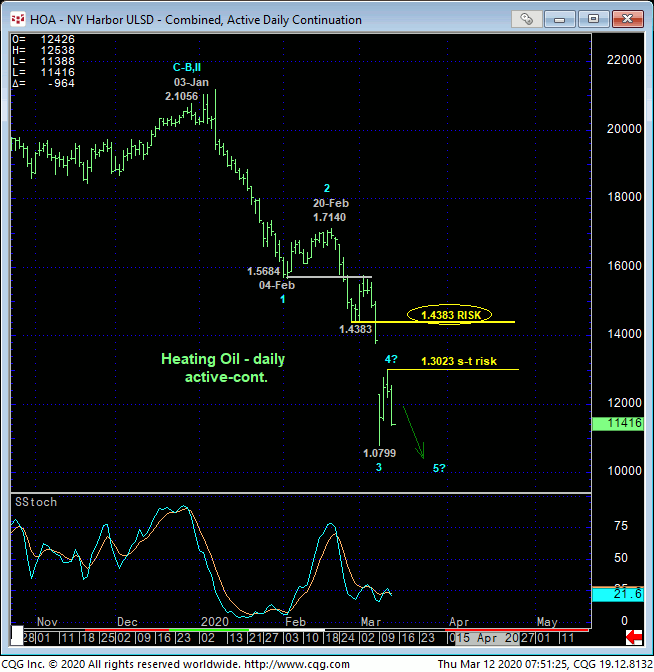
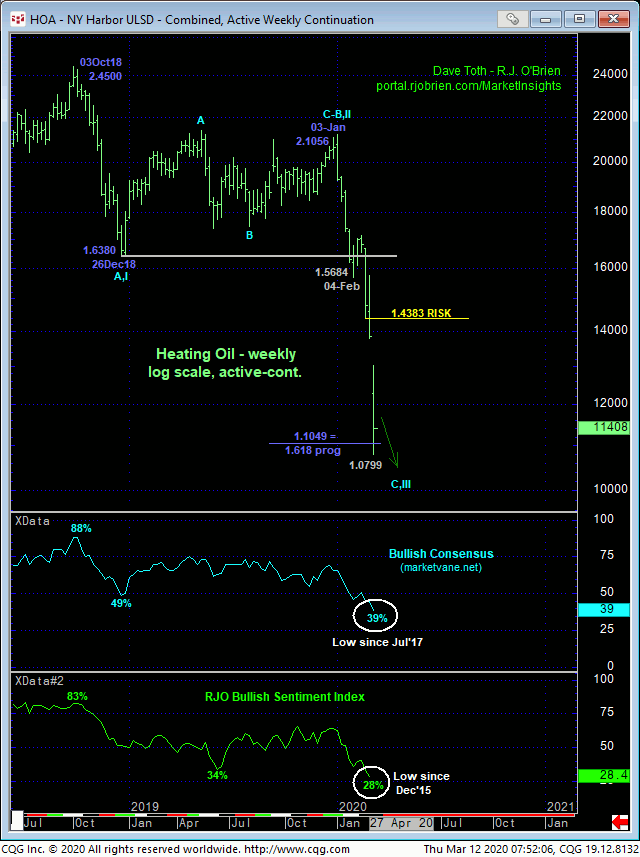
Here too, market sentiment levels have reached historically bearish levels typical of broader BASE/reversal-threat conditions, but this doesn’t matter until and unless the market stems the clear and present downtrend with a confirmed bullish divergence in momentum above a level like 1.3023.
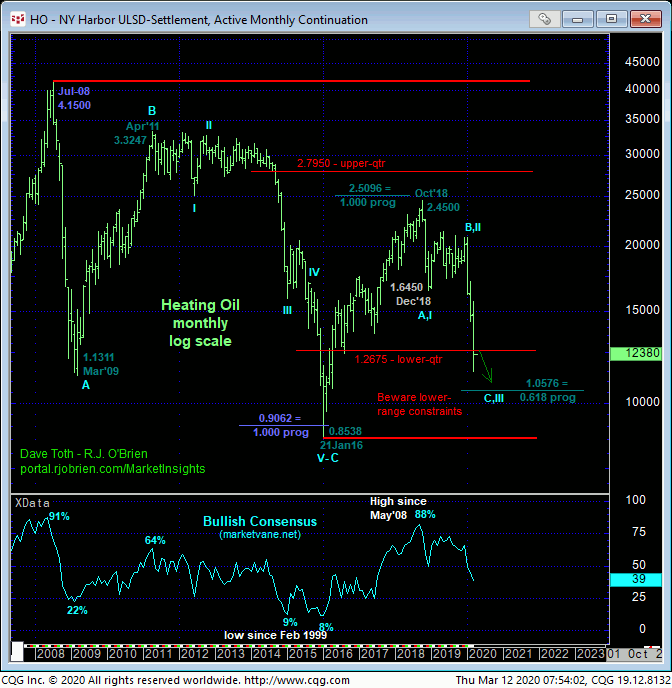
The monthly log chart below shows the market’s engagement of the lower-quarter of its historic 12-year range where gross bearish sentiment and a confirmed bullish divergence in momentum would warn of a base/reversal environment that could be major in scope. But until such a mo failure stems the bear, its remaining downside potential remains indeterminable and potentially extreme.
In sum, a bearish policy and exposure remain advised with a recovery above 1.3023 required to threaten this call enough to warrant moving to the sidelines. In lieu of such strength, further and possibly accelerated losses remain expected.
APR CRUDE OIL
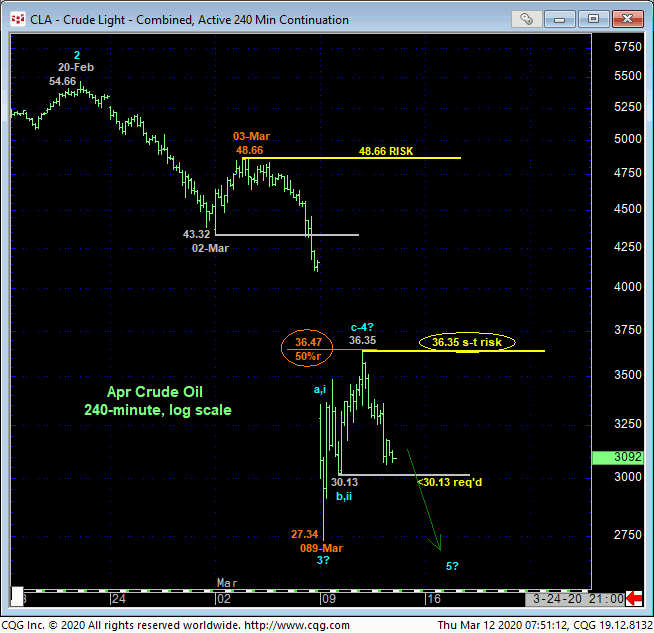
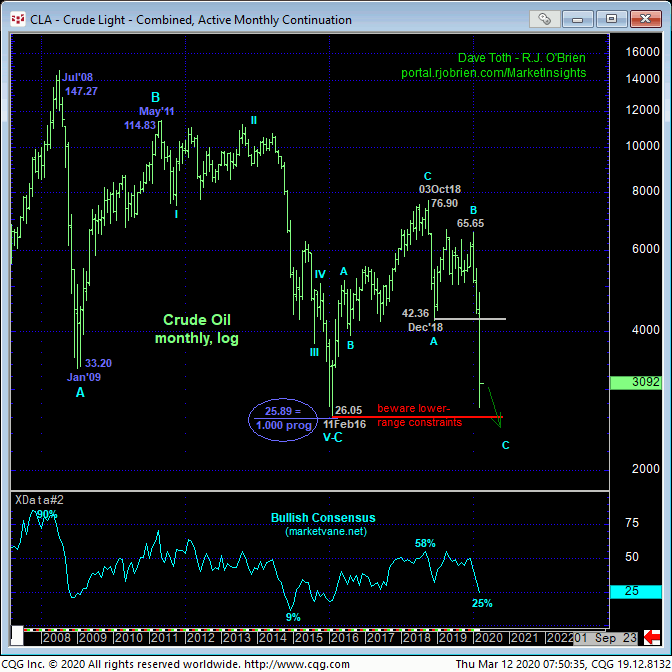
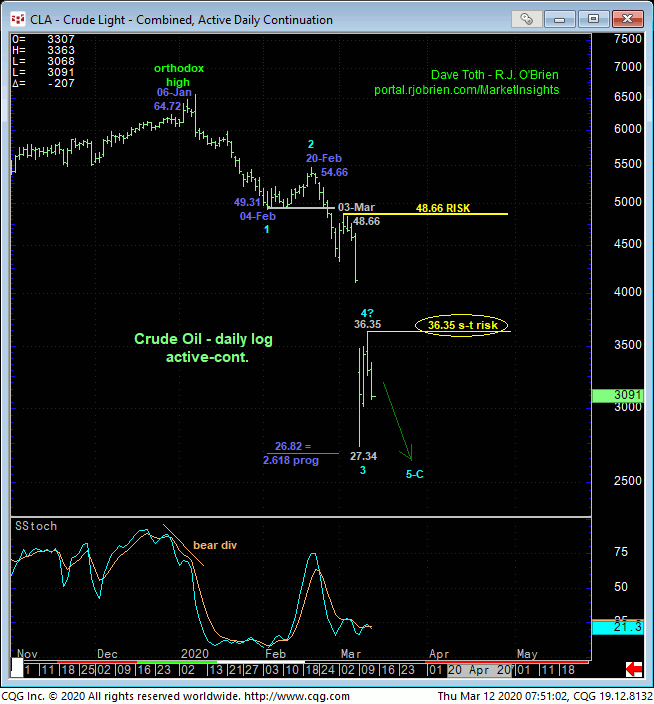
While crude hasn’t failed below Mon afternoon’s 30.13 minor corrective low like heating did with its respective Mon afternoon low, we believe the technical construct of crude is identical to that detailed above for diesel with Wed’s 36.35 high considered the end or upper boundary of a (suspected 4th-Wave) correction ahead of a resumption of the bear to at least one more round of new lows below 27.34. Per such, this 36.35 high becomes our new short-term but key risk parameter from which traders can objectively rebase and manage the risk of a still-advised bearish policy.
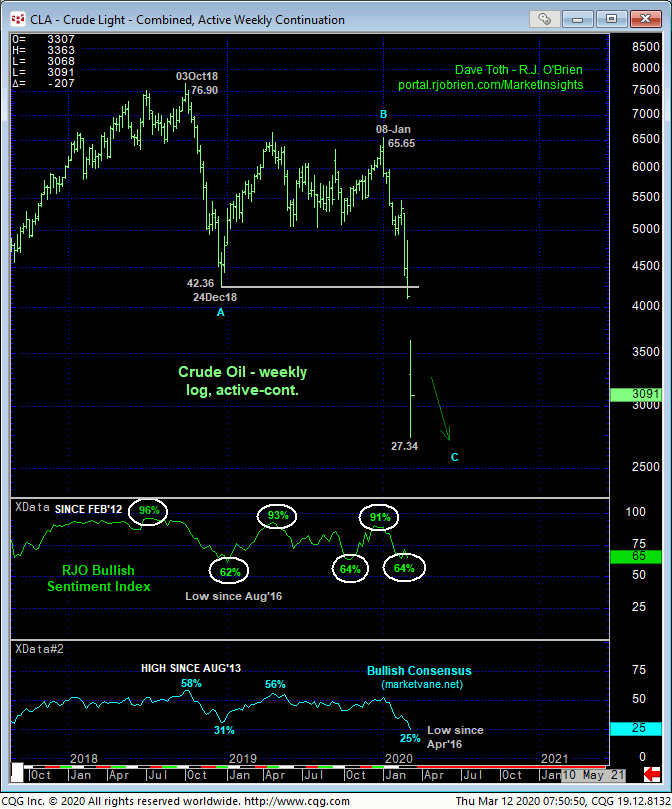
The monthly log chart below shows the market’s assault on the extreme lower recesses of its historical 12-year range. We have no idea if the market will break Feb’16’s 26.05 low or not. But while these extreme lower recesses of the historical range bear watching closely for any bullish divergence in momentum that could easily morph into a major reversal, we don;t believe ANY level below the market matters. Traders should NOT rely or bet on 2016’s low holding. What DOES matter is the specific and objective level(s) this market needs to recoup to even defer, let alone threaten the clear and present and major downtrend. And 36.35 is one of these precise levels.
In sum, a full and aggressive bearish policy and exposure remain advised with a recovery above 36.35 required to threaten this call enough to warrant its cover. In lieu of such strength, the market’s downside potential remains indeterminable and potentially extreme.
