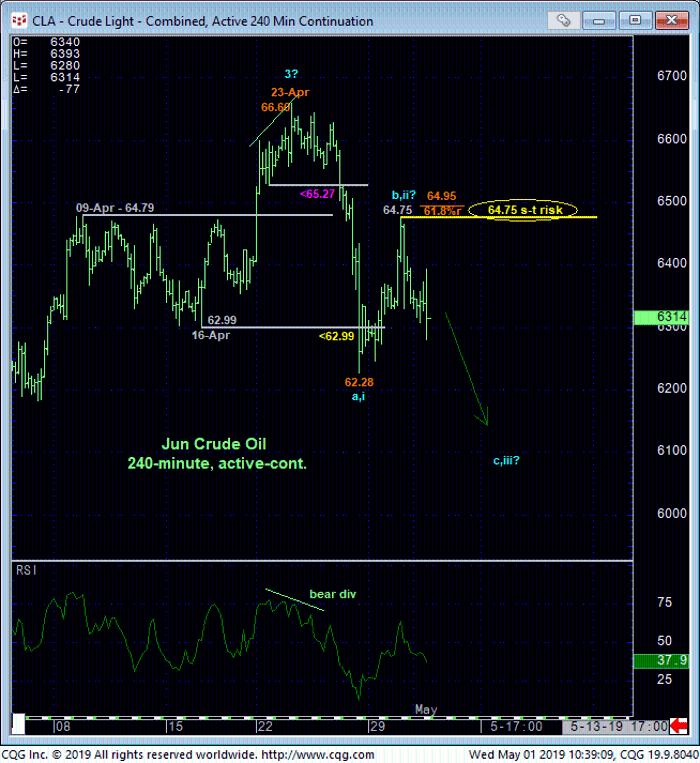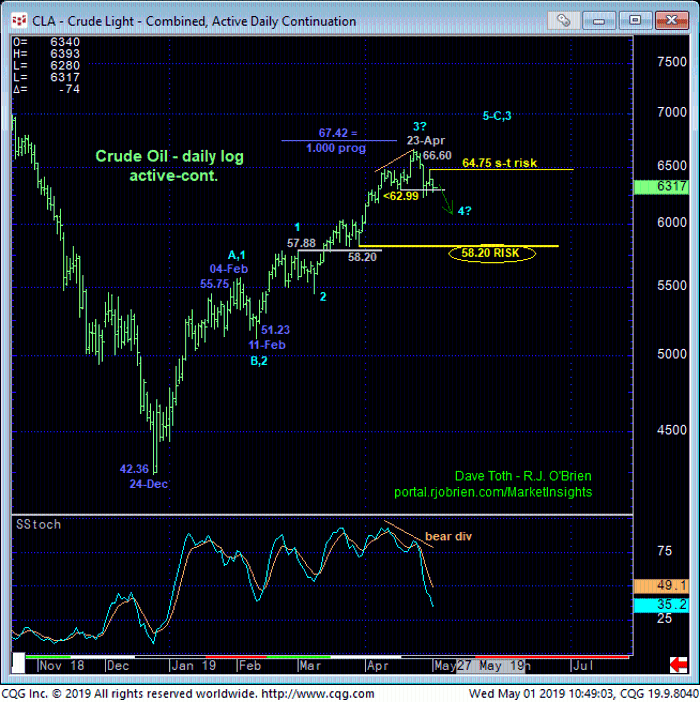
In Fri morning’s Technical Blog we introduced the prospect of a developing peak/reversal threat after only admittedly smaller-degree weakness below 22-Apr’s 65.27 corrective low, requiring subsequent weakness below 16-Apr’s 62.99 corrective low to confirm a bearish divergence in daily momentum. The market confirmed this next degree of weakness within about an hour of that update, identifying 23-Apr’s 66.60 high as one of developing importance ahead of a correction or reversal lower of more significant scope.
Since last Fri, the 240-min chart below shows a near-61.8% retracement attempt and yesterday/today’s relapse that we believe contributes to this peak/reversal threat as part or all of a (B- or 2nd-Wave) correction. As a result and while a bit premature as the market hasn’t broken Fri’s 62.28 initial counter-trend low yet, we believe yesterday’s 64.75 high serves as a tight but objective risk parameter from which non-bullish decisions like long-covers and cautious bearish punts can be objectively rebased and managed.


From a broader perspective and while Dec-Apr’s rally is a very impressive one, the factors warning of a more significant peak/reversal threat are increasingly compelling:
- a confirmed bearish divergence in daily momentum
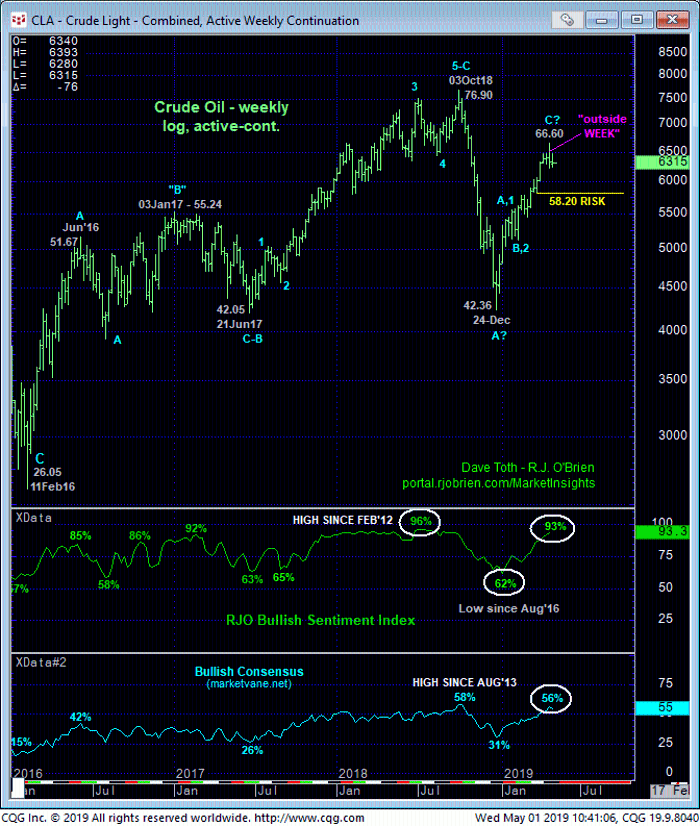
- the market’s return to historically frothy sentiment levels
- last week’s “outside WEEK” (higher high, lower low and lower close than previous week’s range and close).
Again, given the magnitude of even Feb-Apr’s portion of the bull from 51.23, let alone the entire uptrend from 24Dec18’s42.36 low, the bearish divergence in momentum is of an insufficient SCALE tp conclude a major top. But the grotesquely bullish sentiment is hard to ignore as a source of downside vulnerability that could expose surprising losses in the period ahead. And as a result of this week’s recovery attempt and failure, the market has now identified two levels- yesterday’s 64.75 high and certainly 23-Apr’s 66.60 high- from which traders can incur whipsaw risk in exchange for an early leg up on non-bullish decisions like long-covers and cautious bearish punts.
These issues considered, a cautious bearish policy is advised at-the-market (62.95) for shorter-term traders with a recovery above 64.75 required to negate this specific call and warrant its cover. Longer-term players are OK to maintain a cautious bullish policy, but only to the extent that they acknowledge and accept 28-Mar’s 58.20 next larger-degree corrective low as the key long-term risk parameter the market is required to break to break the major uptrend. In lieu of at least 64.75+ strength, we anticipate further lateral-to-lower prices in the period immediately ahead, and quite possibly a more protracted reversal lower.


