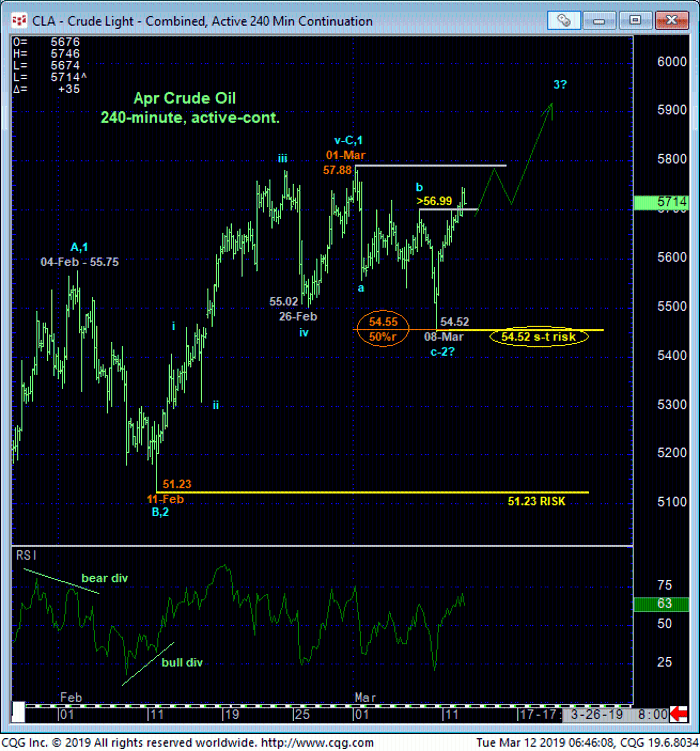
Overnight’s rebound above Thur’s 56.99 high and our short-term risk parameter renders early-Mar’s relapse attempt from 01-Mar’s 57.88 high to Fri’s 54.52 low a 3-wave affair as labeled in the 240-min chart below. Left unaltered by a relapse below 54.52, this 3-wave setback is considered a corrective/consolidative event that warns of a resumption of Feb’s uptrend that preceded it. Per such this 54.52 levels is considered our new short-term risk parameter from which shorter-term traders with tighter risk profiles can objectively rebase and manage the risk of a resumed bullish policy after getting whipsaw out of longs by Fri’s bearish divergence in short-term momentum.
The Fibonacci fact that Fri’s 54.52 low was just 3-cents from the (54.55) 50% retrace of Feb’s 51.23 – 57.88 rally would seem to reinforce this bullish count calling for a run to new highs above 57.88. While 01-Mar’s 57.88 high remains intact as a resistant cap however, we cannot ignore the prospect of further lateral consolidation between this recent 57.88 – 54.52-range.


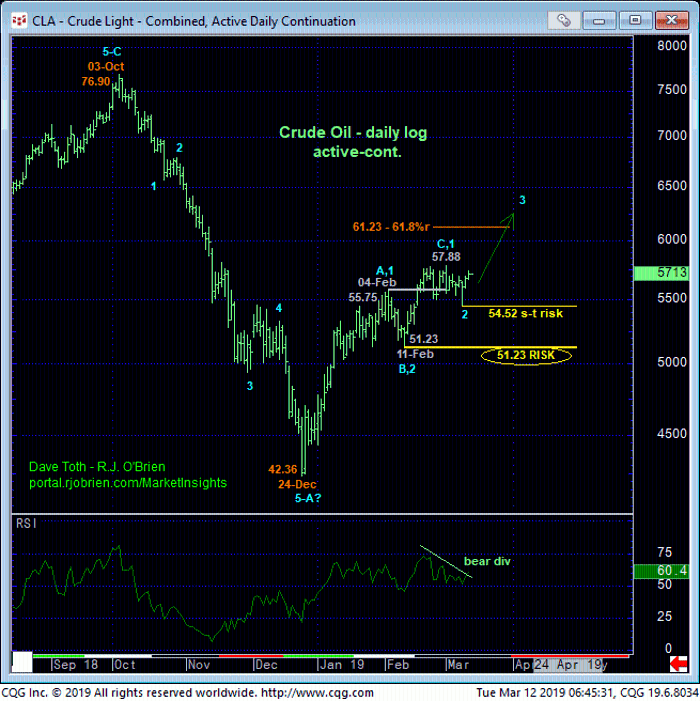
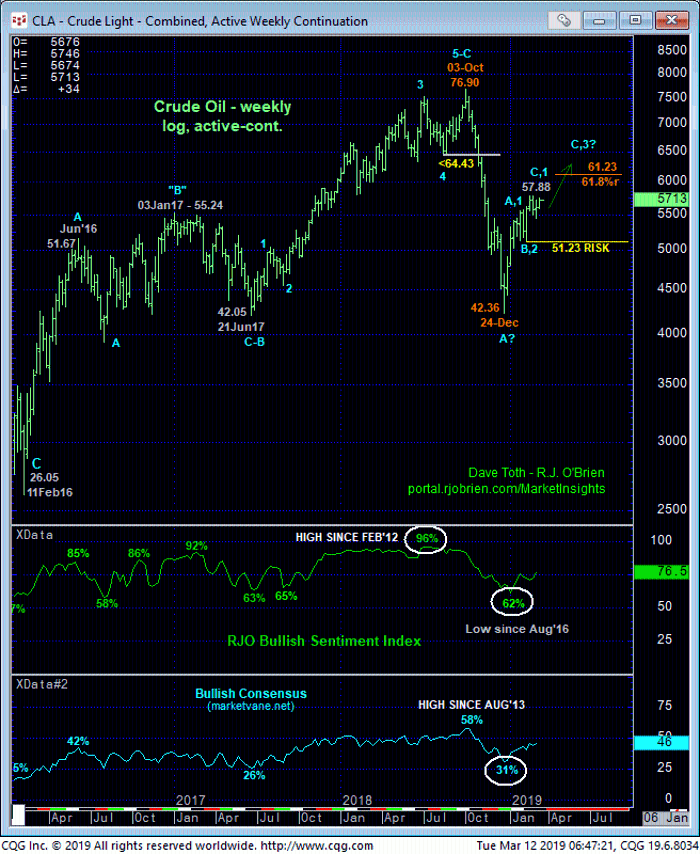
The POTENTIAL for a bearish divergence in daily momentum (above) remains intact, but now we can require specific weakness below 54..52 to CONFIRM this threat and take defensive steps. In lieu of such sub-54.52 weakness the past couple days’ rebound renders the recent slip a textbook corrective bull-flag pattern that warns of a resumption of Feb’s rally that would reinstate and reinforce our broader base/reversal count from 24-Dec’s 42.36 low. And given the extent and uninterrupted nature of 4Q18’s meltdown that left nothing in the way of former battlegrounds that might now be looked to as resistance, there are NO levels of any technical merit above 57.88 to inhibit the bull. The market’s upside potential above 57.88 should thus be considered indeterminable and potentially steep.
These issues considered, a bullish policy remains advised for longer-term players with a failure below 54.52 required to pare bullish exposure to more conservative levels and commensurately larger-degree weakness below 11-Feb’s 51.23 next larger-degree corrective low and key risk parameter required to jettison the position altogether. Shorter-term traders with tighter risk profiles whipsawed out of longs following Fri’s bearish divergence in short-term mo are advised to resumed a bullish policy but to do so cautiously (perhaps via options) “up here” against the upper recesses of the past few weeks’ range where the risk/reward merits of initiating bullish exposure are less favorable. The alternative is to wait for another intra-range relapse for a preferred risk/reward situation and/or wait for a breakout above 57.88 to initiate bullish exposure. Regardless, a relapse below 54.52 is required to negate this call and warrant the cover of any bullish exposure. In lieu of such sub-54.52 we anticipate an eventual bust-out above 57.88 and potentially sharp gains thereafter.


