DEC CORN
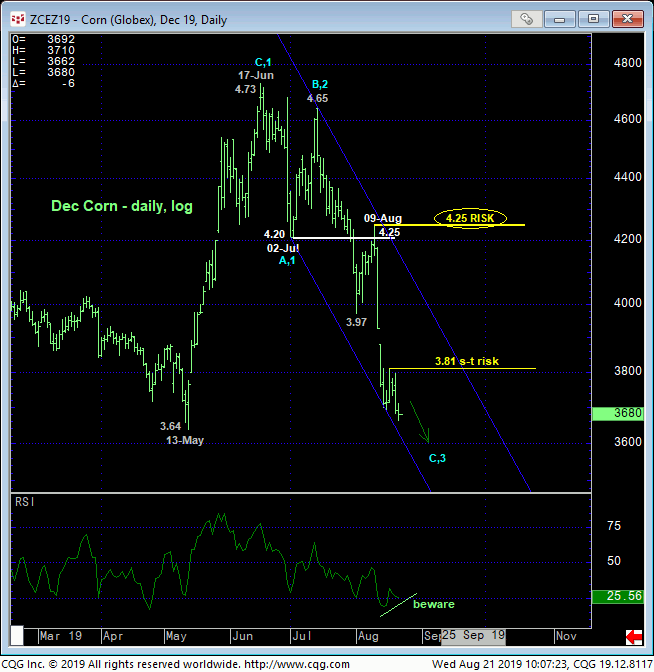
Yesterday afternoon and today’s relapse below last week’s 3.69 low reaffirms the 2-month downtrend and leaves Fri’s 3.81 high in its wake as the latest smaller-degree corrective high the market now needs to sustain losses below to maintain a more immediate bearish count. Its failure to do so will confirm a bullish divergence in admittedly short-term momentum and reject/define a more reliable low, support and risk parameter from which shorter-term traders with tighter risk profiles would be able to objectively base non-bearish decisions like short-covers and cautious bullish punts.
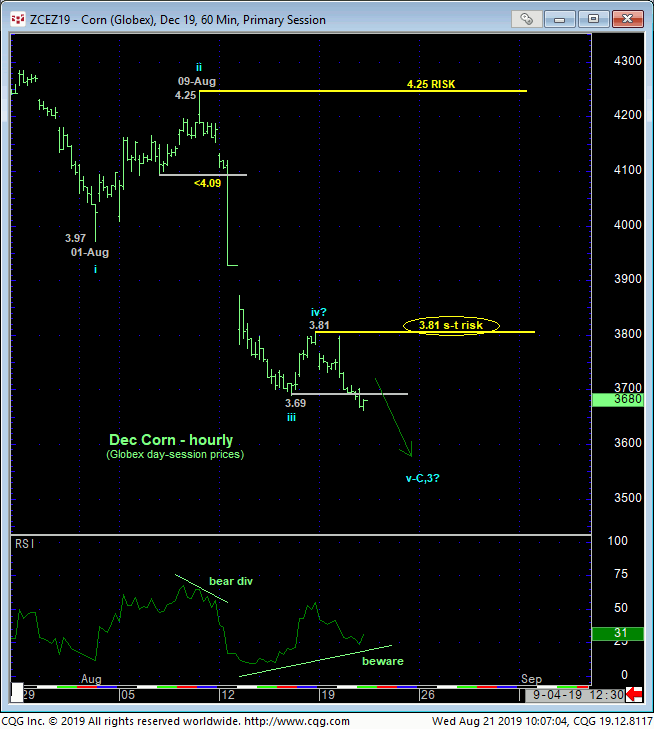
Now, clearly, such a minor mo failure above 3.81 would NOT be of a sufficient scale to conclude the end of the past couple months’ plunge. However, as we mentioned in Fri’s Technical Blog and as the weekly active-continuation chart below shows, the market has very quickly returned to near the 3.60-to-3.40-area that has been a bane for bears for the past TWO YEARS and provided ample opportunity for producers to pare/neutralize unneeded bear hedges “down here” and end-users to build bull hedges.
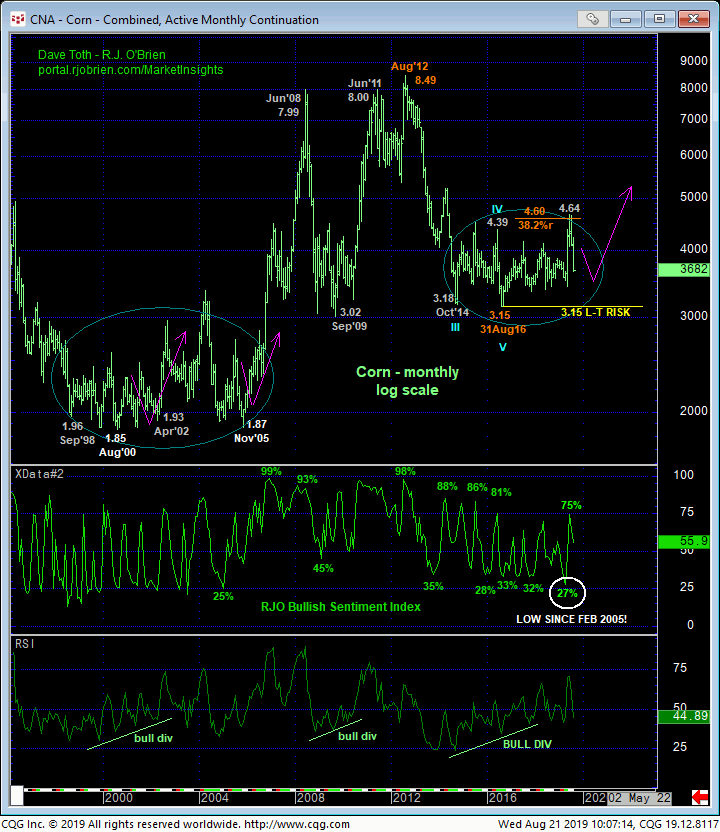
As the market has been unable to crack even the lower-quarter of the massively lateral 4-YEAR range, let alone Aug’16’s 3.15 low, our major, multi-year BASE/reversal count remains intact. Per such, we will be watchful for our three reversal requirements to suggest the current relapse is over and that a return to a bullish policy is advised. These requirements include:
- a confirmed bullish divergence in momentum of a scale sufficient to conclude the end of the larger-degree decline from 17-Jun’s 4.73 high
- proof of trendy, impulsive behavior on rally attempts and, most importantly,
- proof of labored, corrective behavior on subsequent relapse attempts.
This said however, looking at the waning-downside momentum/bottoming processes of Apr-May this year, Sep-Nov’17 and Jul-Aug’16, we could be in store for a frustrating, challenging, aimless 2-steps-down-1-step-up falling-wedge-type environment in the weeks ahead and before the market even satisfies the first of our three reversal requirements.
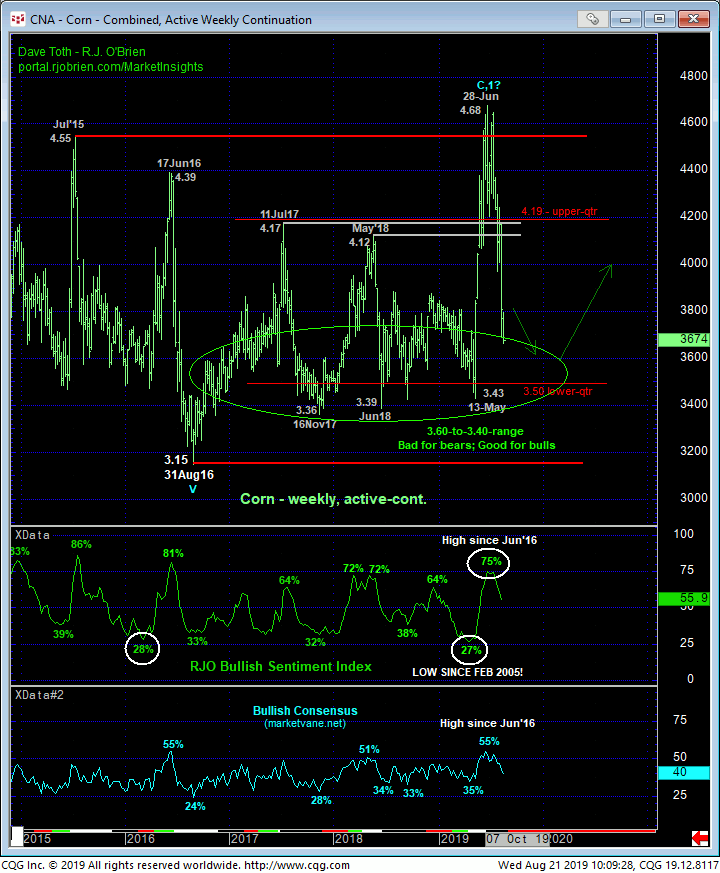
Could this whole base/reversal count be wrong and could the market be headed for sub-3.15 levels? Sure. But as we’ve discussed in 4Q17 and summer’18 and this past May, all the bear needs to do is behave like one by breaking the 3.35-to-3.15-area and sustaining trendy, impulsive behavior south. Until and unless such clear evidence is produced, the past FIVE YEARS’ price action dating from Oct’14’s 3.18 low remains virtually identical to that that stemmed from Sep’98’s 1.96 low that started a SEVEN YEAR base/reversal process that included interim spikes exactly like the one we just experienced in May-Jun.
Against this long-term backdrop and given the market’s engagement of that pivotal 3.60-to-3.40-area, MOMENTUM will be key. For any sign of a bullish divergence in mo “down here” that threatens the current 2-month slide will resurrect this long-term base/reversal count and provide what we believe will be excellent longer-term risk/reward opportunities from the bull side. For the time being however the trend remains down and should not surprise by further lateral-to-lower prices ahead.
A recovery above 3.81 will defer the bear enough for shorter-term traders to pare or neutralize exposure and reduce or circumvent the heights unknown of a probable corrective hiccup but possibly a bigger reversal. Commensurately larger-degree strength above 09-Aug’s 4.25 larger-degree corrective high and key risk parameter remains required to nullify any broader bearish count and warrant long-term players to move to neutral. We suspect however that in the waning-downside-momentum/bottoming process behavior in what could be the many weeks ahead, the market will identify a more practical bear risk parameter for long-term players than a level kinda up there like 4.25. In lieu of strength above at least 3.81, further lateral-to-lower prices remain expected in the period ahead.
NOV SOYBEANS
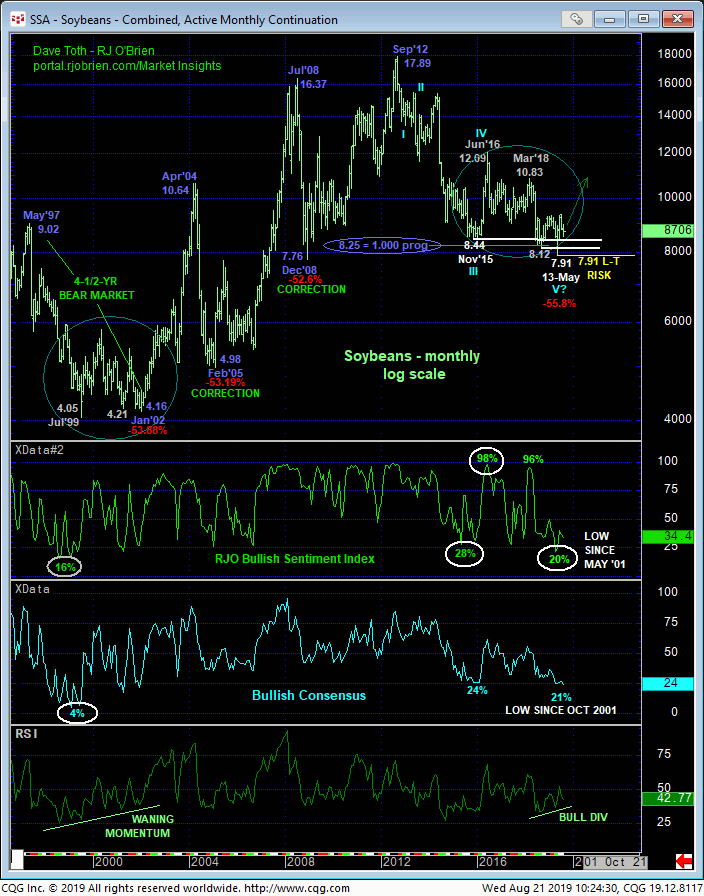
The longer-term base/reversal-threat environment in beans is unfolding a little differently than corn, but we believe the end result will be the same. The past four years’ price action circled in the monthly log chart below looks the same as that that ended the May 197 – Jan 2002 bear market. Downside momentum waned from 3Q99 until Jan’02’s ultimate bottom and reversal amidst historically bearish sentiment levels. That 1997-2002 bear lost nearly 54% while both the 2004-05’s meltdown and 2008’s spasm spanned 53%. The nearly-seven-year bear market from Se’12’s 17.89 all-time high to 13May19’s 7.91 low is a 56% decline that produced the most bearish sentiment/contrary opinion levels since 2001.
It’s like looking in a mirror with May’s 7.91 low the key long-term risk parameter this market is required to break to negate this long-term base/reversal count.
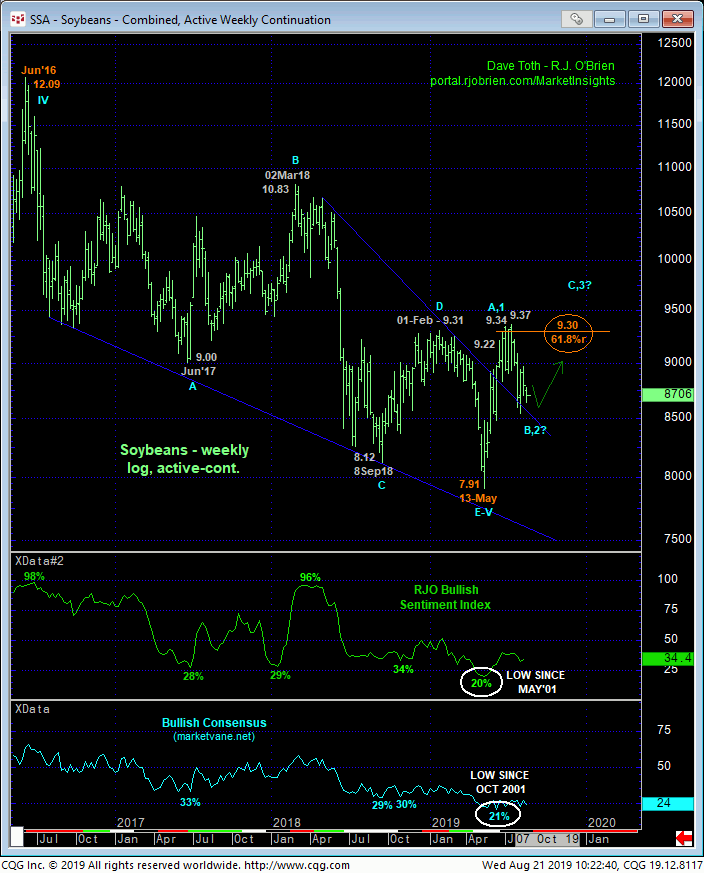
On a weekly log basis below, May-Jun’s trendy, impulsive rally above Feb’s 9.31 high confirms a bullish divergence in momentum on a major scale that breaks at least the downtrend from Mar’18’s 10.83 high and very possibly a secular 5-wave decline from 2012’s 17.89 all-time high. This chart also shows still-bearish sentiment/contrary opinion levels by the huddles masses. And the fact that May-Jun’s rally doesn’t seem to have changed these minds much, technically, reinforces a broader base/reversal-threat environment.
As base/reversal processes include interim corrective rebuttals to initial counter-trend rallies however, the past couple months’ setback comes as no surprise at all. The challenge now comes in 1) navigating its end via another momentum failure and 2) identifying proof of labored, 3-wave corrective behavior.
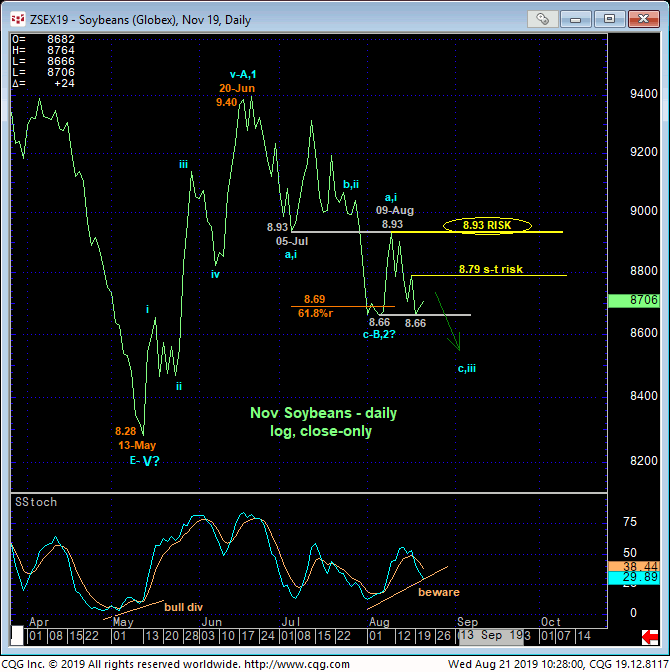
The daily log close-only chart below shows the impulsive 5-wave rally from 13-May’s 8.328 low to 20-Jun’s 9.40 high as well as a correction that has thus far retraced a not-atypical 61.8% of the initial May-Jun rally. With the 8.66-area thus far providing support and evidence of waning downside momentum, this market may be close or closer to ending the (2nd-Wave) correction and presenting a risk/reward buying opportunity that could span the long-term.
On this daily basis commensurately larger-degree strength above 09-Aug’s 8.93 high and area of former support-turned-resistance, we believe, will identify the Jun-Aug decline as a 3-wave and thus corrective structure that then could expose significant gains and even a resumption of May-Jun’s uptrend to new highs above 9.40. Until such 8.93+ strength is proven, it would be premature to conclude the end of the 2-month slide.
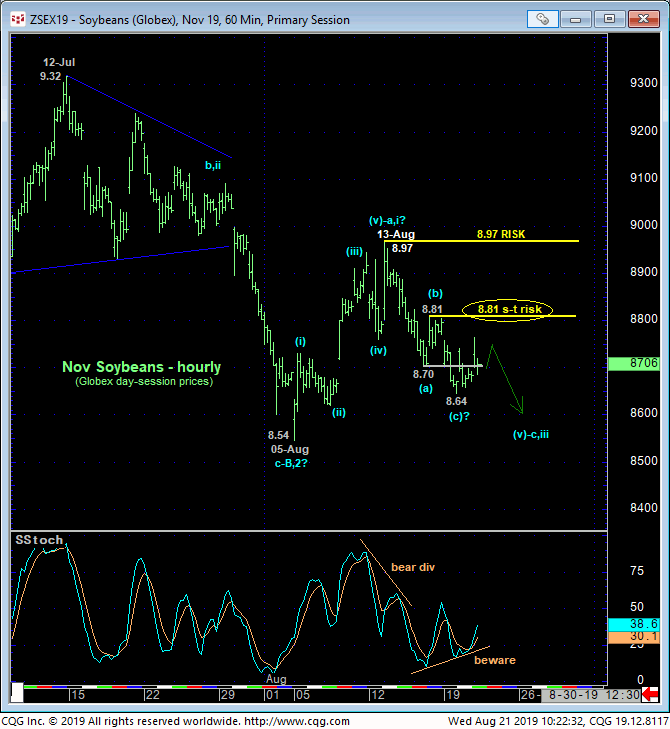
Drilling down even further to an hourly chart below, the story gets even more acute. Mon’s continued relapse leaves Fri’s 8.81 high in its wake as the latest smaller-degree corrective high and new short-term risk parameter the market needs to sustain losses below to maintain a more immediate bearish count. Its failure to do so will confirm a bullish divergence in momentum that would stem the relapse from last week’s 8.997 high and render it a 3-wave and thus corrective affair that could then re-expose early-Aug’s 8.54 – 8.97 uptrend. And the prospect that that initial rally is a trendy, impulsive 5-wave affair would also seem to reinforce a smaller-degree base/reversal count that could be sneaking up on us. And once above last week’s 8.97 high and given still-bearish sentiment by the masses, we believe this market has the potential to shock traders with gains thereafter.
These issues considered, a bearish policy and exposure remain OK with a recovery above 8.81 required for shorter-term traders to move to the sidelines. Commensurately larger-degree strength above 8.97 (8.93 on a closing basis) is required for longer-term players to take similar defensive steps ahead of a policy change to a new bullish policy that, again, we think could be rather shocking given the current bearish sentiment/contrary opinion levels.
