JAN SOYBEANS
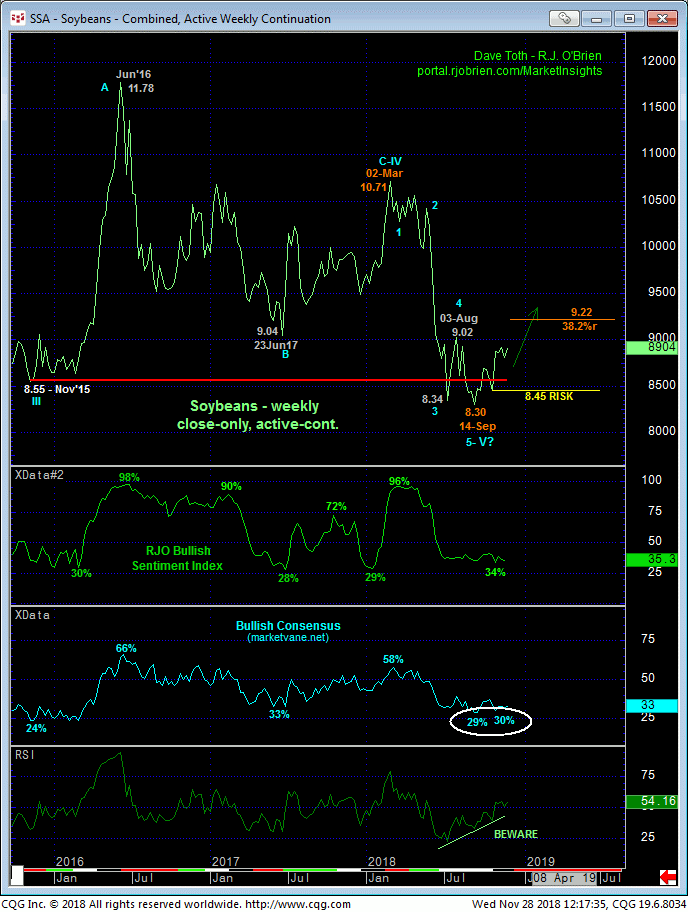
With today’s recovery above 21-Nov’s 8.89 high, the market has once again shown that it can only trade lower in a labored, 3-wave corrective manner, leaving Mon’s 8.57 low in its wake as the latest smaller-degree corrective low it now has got to fail below to threaten a bullish count. Left unaltered by a relapse below 8.57, the sell-off attempt from 15-Nov’s 8.96 high is a 3-wave and thus corrective event that warns of a resumption of early-Nov’s rally that preceded it. Moreover, the broader and mere lateral nature of the price action from 15-OCT’s 9.06 high looks about as corrective and consolidative as it gets, warning of even further gains above that pivotal 9.06 flexion point.
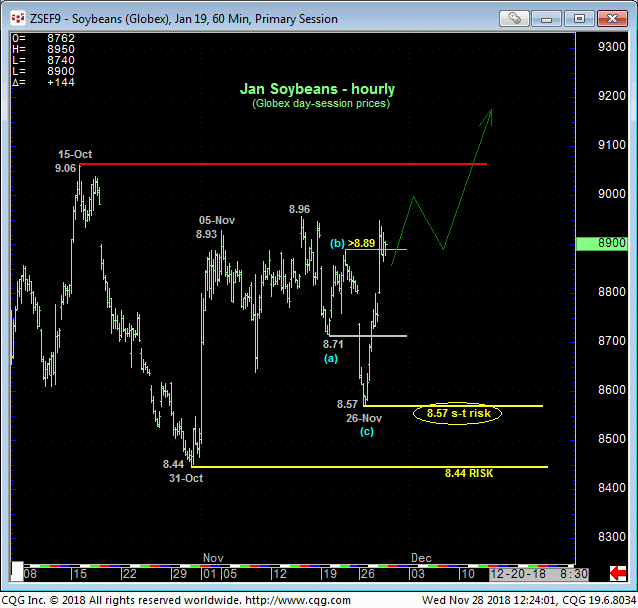
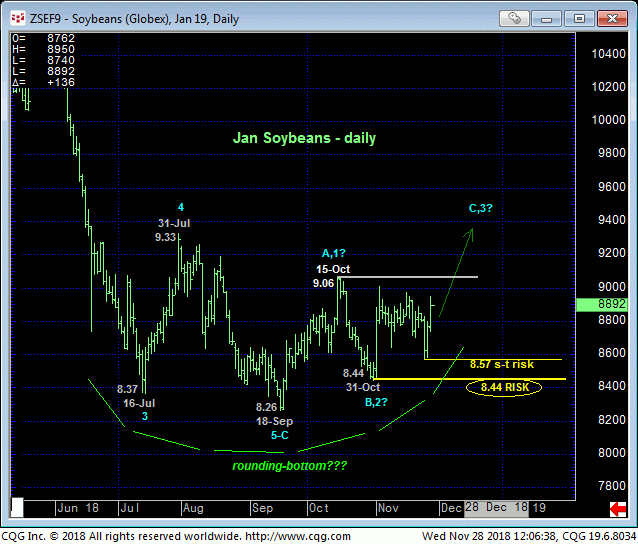
This rebound, while still entrapped within the past couple months’ range, is further reinforcing proof of our broader base/reversal count introduced in 21-Sep’s Technical Blog following 20-Sep’s bullish divergence in momentum despite historically bearish supply conditions. More than two months on, we can now look back one two full months of basing behavior with smaller- and larger-degree corrective lows at 8.57 and 31-Oct’s 8.44 low as specific risk parameters from which a bullish policy and exposure can be objectively based and managed.
While 15-Oct’s key 9.06 high has yet to be broken, the base/reversal factors still in place include:
- a massive “rounding-bottom” formation shown in the daily chart above
- that 20-Sep bullish divergence in momentum that defined 18-Sep’s 8.26 low as one of developing importance that has yet to be even challenged
- historically bearish sentiment levels typical of major base/reversal conditions
- the developing prospect for a bullish divergence in WEEKLY momentum (confirmed above 9.06)
- THREE (including this week’s if the market closes Fri above 8.81) “outside WEEKS up” since the week of the low.
We believe these factors present a condition and opportunity in which this market might be vulnerable to sharp, sustained, obvious gains at any time in the near future. To mitigate this potentially very bullish count, all the market has to do is failure below at least 8.57 and preferably 8.44.
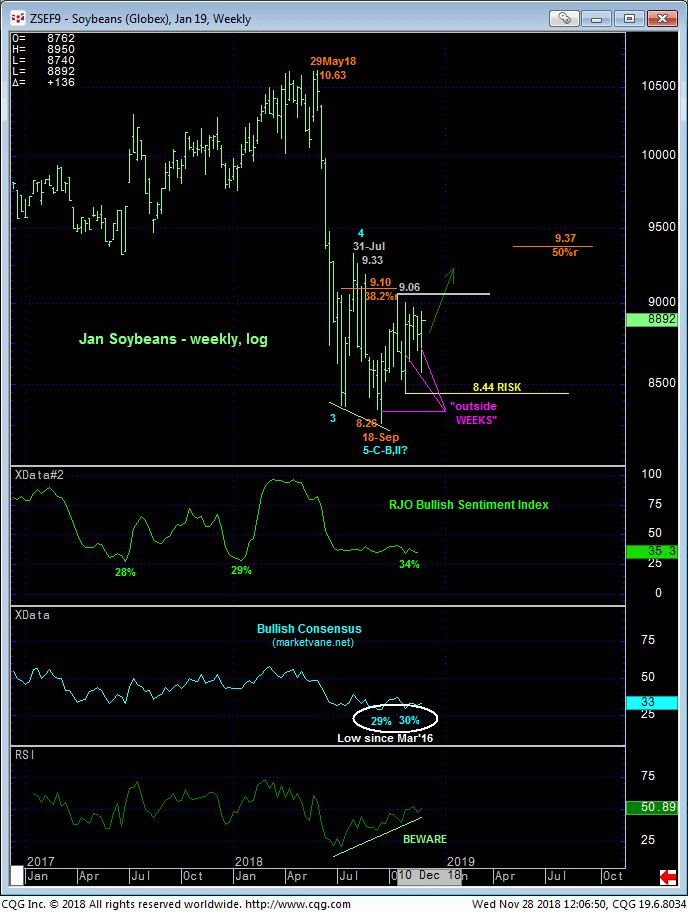
Even in the days immediately following 12-Sep’s key crop production report when the market has establishing new lows, we discussed the crucial importance “down there” of the bear continuing to “perform” like a bear. This required, quite simply, the market sustaining losses below 10-Sep’s 8,52 high in the then-prompt Nov contract. Not only did the bear fail this test, it has subsequently survived a mid-to-late-Oct corrective retest and is pressuring recent range HIGHS, not its lows. All the while with the huddled masses maintaining historically bearish views. Technically, this is exactly how and why market’s bottom and reverse.
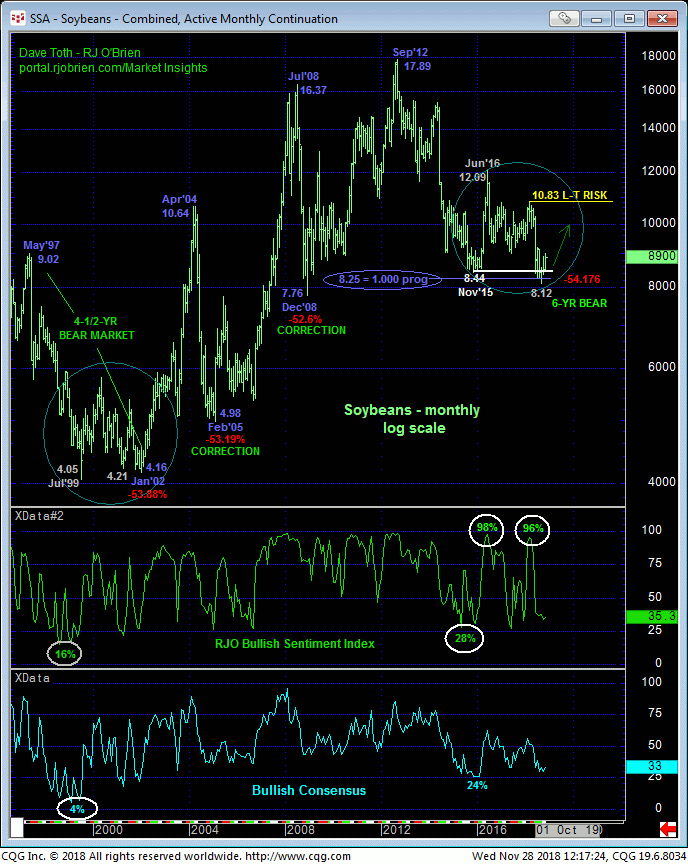
Finally and as discussed many times in this blog, traders are reminded that the past three years’ price action remains eerily similar to the base/reversal behavior surrounding Jan’02’s 4.16 low. And it remains very interesting and perhaps crucial to know that the secular bear market from Sep’12’s 17.89 high spanned a length within 13-cents of that 1997 – 2002 bear market (i.e. 1.000 progression) and within dimes of the 2004-05 and 2008 declines.
On the massive monthly log scale below, to be sure, commensurately larger-degree strength above May’s 10.83 corrective high remains required to, in fact, break the 6-year bear market. But until and unless this market fails below at least 8.57 and preferably 8.44, we believe the risk/reward benefits of a bullish policy and exposure from currently levels to be extraordinary.
In sum, and since the market has blown out the upper border of the past couple months’ range, we could see further lateral chop in the days or even weeks ahead. But until threatened by a failure below 8.57, we anticipate a potentially extensive and sustained breakout above 15-Oct’s key 9.06 flexion point to indeterminable and potentially extensive gains. A bullish policy and exposure remain advised for both short and long-term players with a failure below 8.57 required for shorter-term traders to step aside and below 8.44 for long-term players to take similar defensive measures.
JAN SOYBEAN MEAL
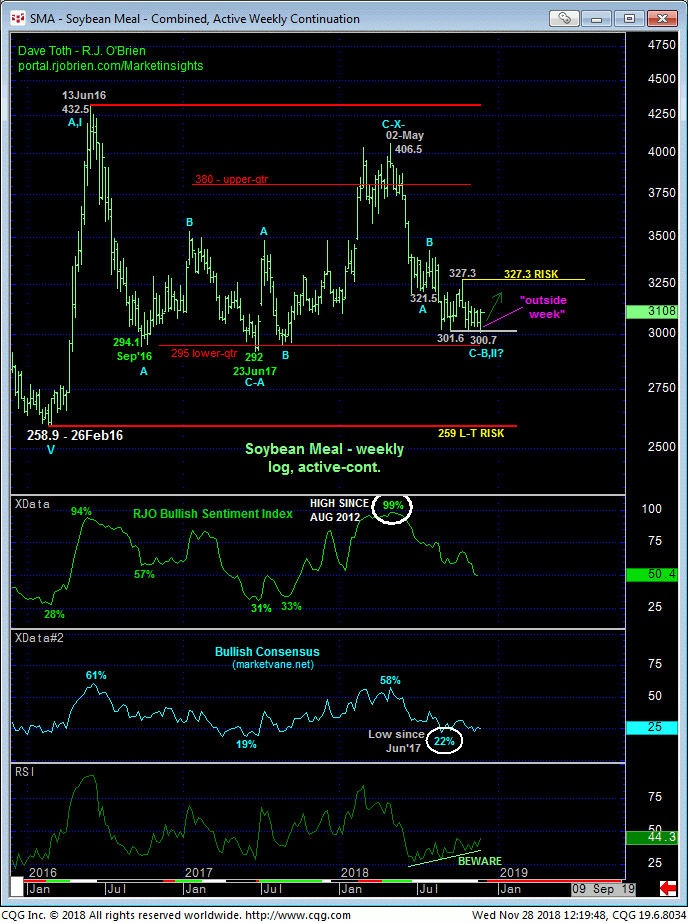
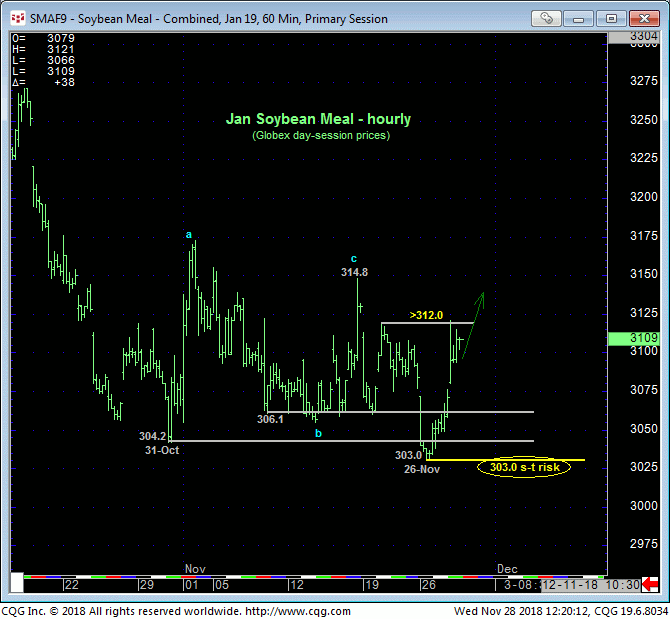
In just Mon’s Technical Blog as the 7-month downtrend was making a new low, we discussed the importance of the bear SUSTAINING those new lows below 20-Nov’s 311.9 smaller-degree corrective high since the market was once again approaching the 300-to-290-lower-quarter of the multi-year lateral range that has repelled all previous attacks. Again, we cannot conclude a major base/reversal environment from proof of only short-term strength. But under the conditions we’ll discuss below and given the bullish count in beans, we believe Mon’s 303.0 low now serves as our new short-term risk parameter from which non-bearish decisions like short-covers and cautious bullish punts can be objectively based and managed.
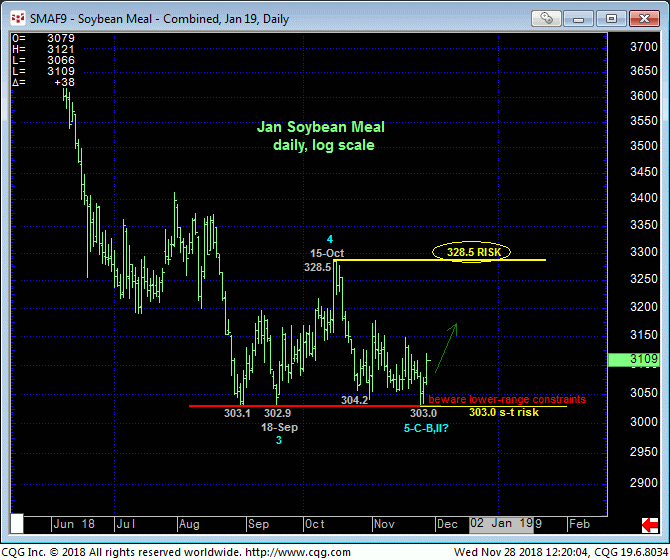
The daily log chart above shows the pertinence of the 303-area that has supported this market for three months. The old saying that “Double-bottoms hold, triple-bottoms fold” may apply here, but the market has been accommodative in defining Mon’s 303.0 low as an objective one below which to come to this conclusion. Until such sub-303.0 weakness is proven, these levels at the extreme lower recesses of the past quarter’s range and just a spit away from the (295) lower-quarter of the past 3-YEAR range present a slippery slope for bears.
The weekly log active-continuation chart below shows waning downside momentum (confirmed above 327) amidst historically low levels in the Bullish Consensus (marketvane.net) and the return to neutral/indifferent/confused levels in our RJO Bullish Sentiment Index. The market also is working on an “outside week up” if it closes Fri above 304.0.
To be sure, the market hasn’t provided anywhere near the amount of recovery (like beans have) to conclude Mon’s 303.0 low as the end of the major downtrend from 02-May’s 406.5 high. But until and unless the market relapses below 303.0, shorter-tern traders with tighter risk profiles have a pure and favorable risk/reward buying opportunity at hand. We will be watchful in the days ahead for proof of labored, corrective behavior on intra-day relapse attempts as reinforcing evidence to a broader base/reversal count. And needless to say, a relapse below 303 will mitigate any base/reversal count, reinstate the bear and resurrect the exact technical condition we discussed in Mon’s update.
