Posted on Jun 15, 2023, 07:29 by Dave Toth
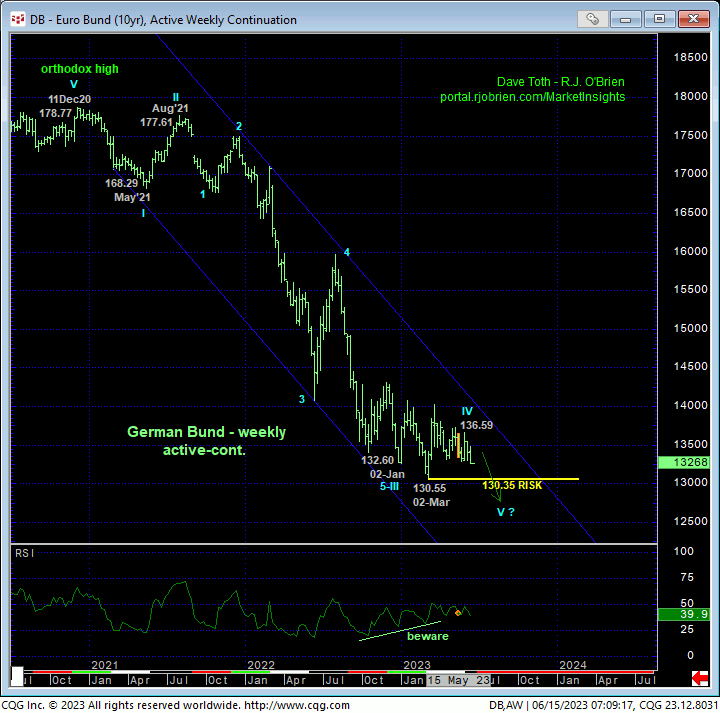
This market has been in a lateral mess for the past eight months in which the correction-vs-reversal debate has taken numerous swings. With today’s clear break below last week’s 132.97 low, this latest swing (down) reinforces a count calling this multi-quarter chop a corrective/consolidative affair ahead of an eventual resumption of the secular bear trend to at least one more round of (5th-Wave) new lows below 02-Mar’s 130.55 low.
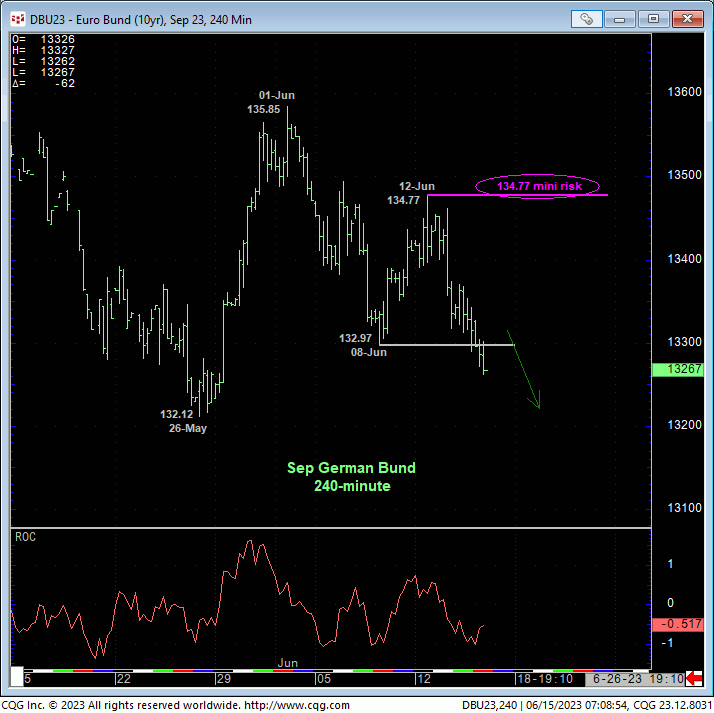
On a short-term basis detailed in the 240-min chart below of the now-prompt Sep contract, today’s break below 08-Jun’s 132.97 low reaffirms at least the intermediate-term trend as down and defines Mon’s 134.77 high as the latest smaller-degree corrective high this market is now minimally required to recoup to even defer, let alone threaten a broader bearish count. Peer such, this 134.77 level serves as our new mini bear risk parameter from which shorter-term traders can objectively rebase and manage non-bullish decisions like long-covers and bearish punts.
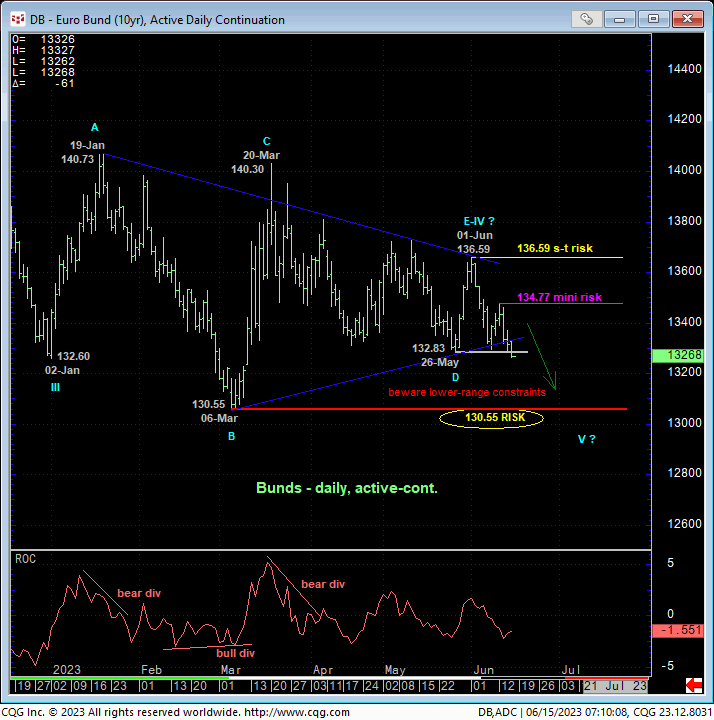
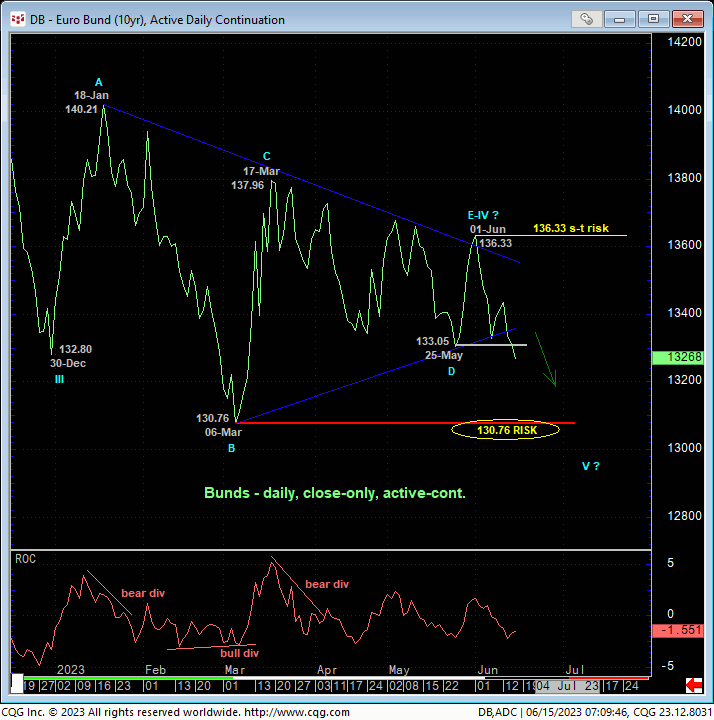
On a broader daily active-continuation basis, the bar chart above shows 01-Jun’s 136.59 high as a recent corrective high this market is now required to recover above to negate what we believe is a lateral triangle pattern that dates from 02-Jan’s 132.60 low. This triangle pattern is a bit easier to discern on a close-only basis below, where a close above 01-Jun’s 136.33 corrective high close is required to negate it. Per such, these corrective highs at 136.59 and/or 136.33 serve as our short-term parameters from which the risk of a resumed or continued bearish policy can be objectively rebased and managed by even longer-term institutional players.
The only reason we cannot conclude these 01-Jun’s thresholds as our new long-term bear risk parameters is because the early-Mar lows and support at 130.55 (intra-day) and 130.76 (closing basis) have yet to be broken in order to CONCLUDE the resumption of the secular bear trend. Until these lows and support are broken, it’s premature to conclude a broader base/reversal process is not still intact.
From an even longer-term perspective, the weekly chart below shows the magnitude of the secular bear trend from Dec’20’s 178.77 orthodox high where it’s not hard to envision a continuation of this trend to new lows below 130.35. But the proof remains in the proverbial pudding.
These issues considered, a cautiously bearish policy and exposure remain advised with a recovery above at least 134.77 required to defer or threaten this call and warrant its cover. In lieu of such strength, further and possibly accelerated losses should not surprise, including a resumption of the secular bear to new lows below 130.55.