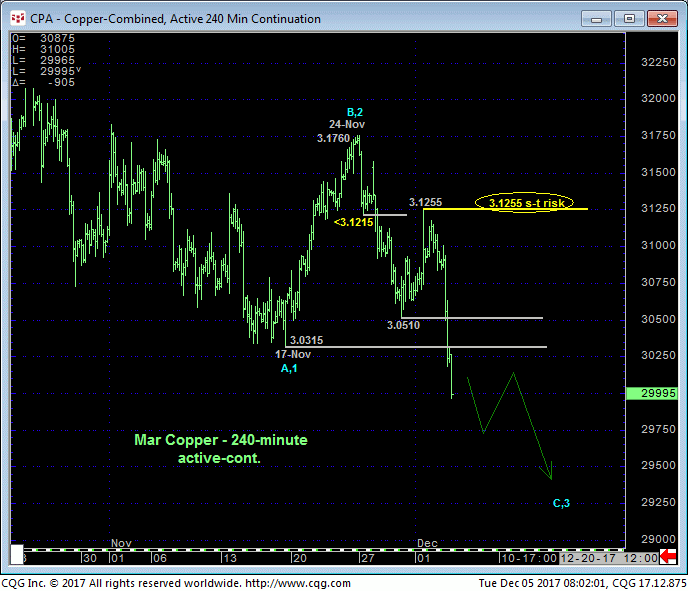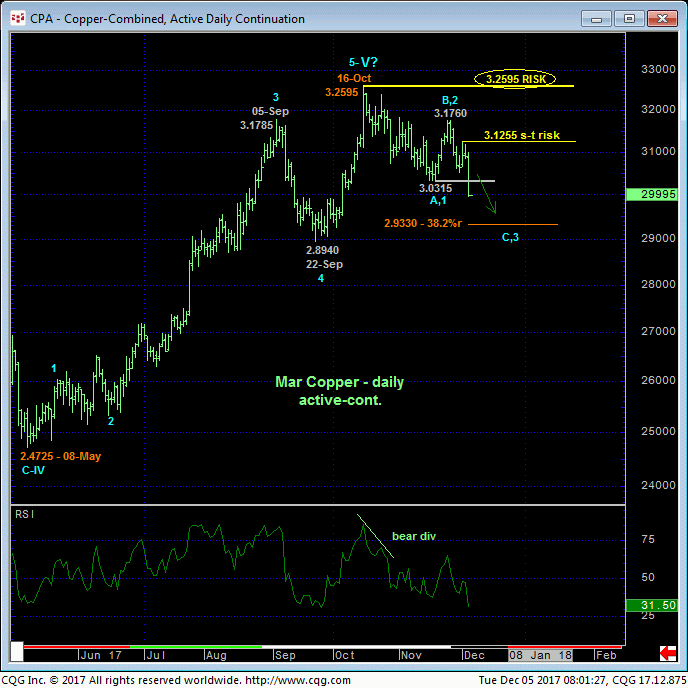
Today’s clear, impulsive break below both Thur’s 3.0510 low and 17-Nov’s 3.0315 initial counter-trend low is consistent with our broader peak/reversal count introduced in 27-Oct’s Trading Strategies Blog and leaves Fri’s 3.1255 high in its wake as the latest smaller-degree corrective high this market is now minimally required to recoup to threaten this bearish call. Per such 3.1255 is considered our new short-term risk parameter from which shorter-term traders with tighter risk profiles can objectively rebase and manage the risk of a still-advised bearish policy and exposure from 3.1400 OB. Former 3.03-to-3.05-area support is considered new near-term resistance ahead of further and possibly steep losses.


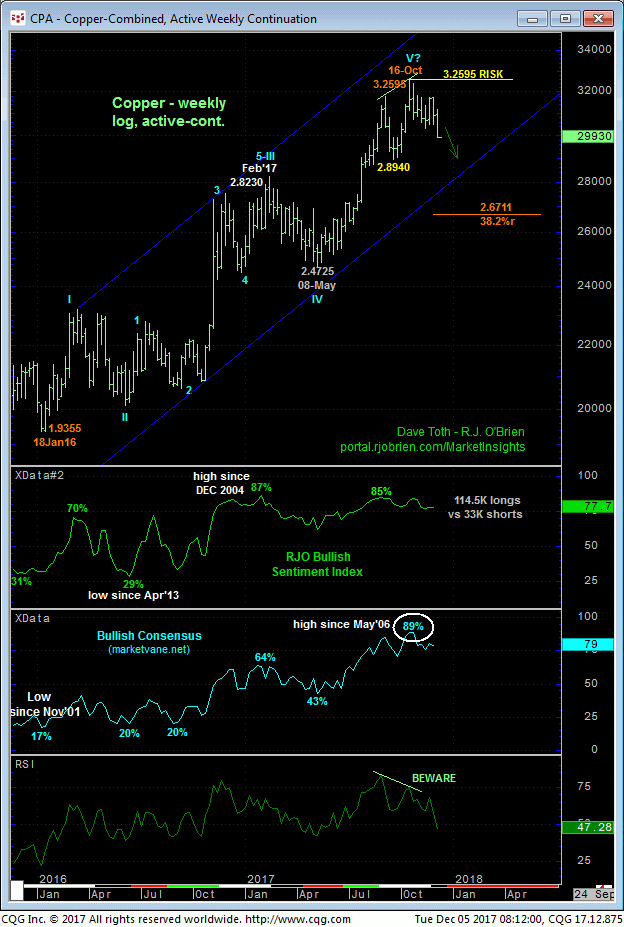
With today’s resumed weakness shown in the daily chart above, the market can now look back on a month-and-a-half’s worth of peak/reversal-threat behavior while the weekly log active-continuation chart below provides the factors on which a broader peak/reversal count are predicated, including:
• an arguably complete 5-wave Elliott sequence from Jan’16’s 1.9355 low amidst
• historically frothy sentiment not seen since at least 2006 and
• waning upside momentum.
To be sure, given the magnitude of 21-month uptrend, the market has yet to erode enough to suggest the past mere month-and-a-half’s setback is anything more than another interim BULL market correction. But until and unless this market recoups at least Thur’s 3.1255 corrective high and short-term risk parameter, the listed items above are unique and compelling and, if correct as bearish threats, could expose extensive losses in the week and even months ahead.
In sum, a bearish policy and exposure from 3.1400 OB remain advised with strength above 3.1255 required to threaten this call enough to warrant its cover. In lieu of such 3.1255+ strength further and possibly accelerated losses remain expected.

%MCEPASTEBIN%

