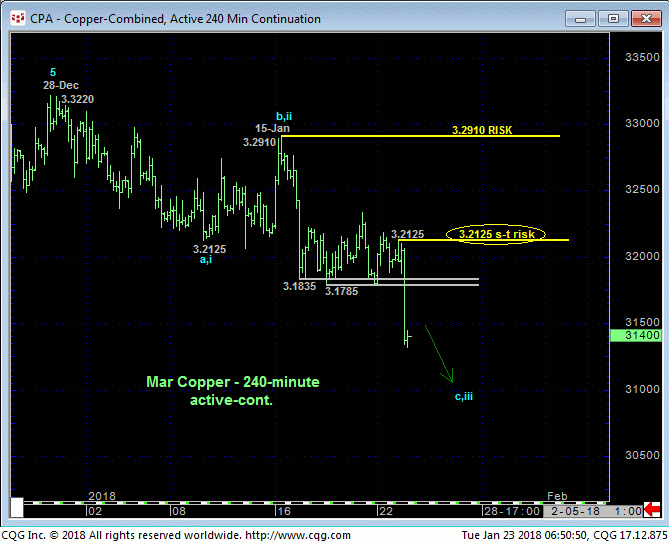
Today’s clear break below the past week’s 3.1800-area support reinforces our broader peak/reversal count introduced in 03-Jan’s Technical Blog and leaves today’s 3.2125 high in its wake as the latest smaller-degree corrective high this market is now minimally required to recoup to mitigate a more immediate bearish count. In this regard 3.2125 is considered our new short-term risk parameter from which traders can effectively rebase and manage the risk of a bearish policy and exposure.

The daily log scale chart below shows the developing downtrend that requires a recovery above 16-Jan’s 3.2910 next larger-degree corrective high to render the sell-off attempt from 28-Dec’s 3.3220 high a 3-wave and thus corrective affair needed to re-expose the secular uptrend. In lieu of such commensurately larger-degree strength and for compelling reasons we’ll list below, a more protracted move south is expected.
This chart also shows the market nearing the (3.1268) 50% retrace of Dec’s 2.9430 – 3.3220-rally. This Fibonacci fact means nothing (i.e. it is NOT considered support) until and unless the market stems the clear and present downtrend with a confirmed bullish divergence in momentum. IF this merely derived level holds and IF the market recovers above at least 3.2125, then fine, we can more objectively consider another bull market correction count.

The most damning technical evidence threatening what has been an incredible nearly-2-YEAR bull run includes:
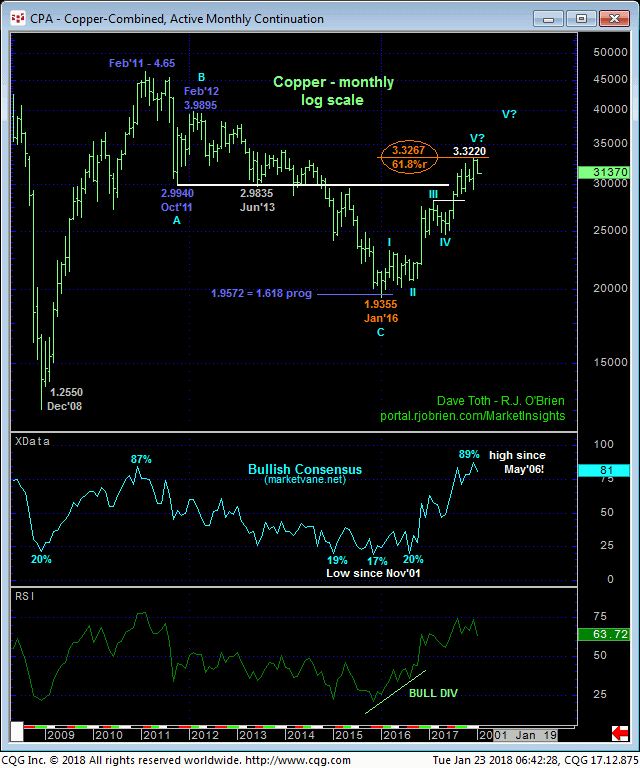
- historically frothy bullish sentiment shown in the weekly (above) and monthly (below) log scale charts
- an arguably complete major 5-wave Elliott sequence from Jan’16’s 1.9355 low labeled in both of these charts
- waning upside momentum on a massive scale (although this won;t be “confirmed” until a failure below 05Dec17’s 2.9430 corrective low)
- the market’s rejection thus far of pretty much the exact (3.3267) 61.8% retrace of the entire secular bear market from Feb’11’s 4.65 all-time high to Jan’16’s 1.9355 low on a monthly log scale basis below.
While the past three weeks’ erosion is of a SCALE far, far from sufficient to conclude anything more than another interim (BULL market) corrective hiccup, the risk/reward merits of even a cautious bearish policy from current levels are off the charts if this peak/reversal count is correct. These issues considered, traders are advised to add to cautious bearish exposure from 3.2600 OB by first approaching recovery attempts to 3.1700 OB as corrective selling opportunities with strength above 3.2125 minimally required to pare or neutralize exposure. Former 3.1800-area support is considered new near-term resistance ahead of further and possibly surprising losses in the weeks and perhaps even months ahead.


