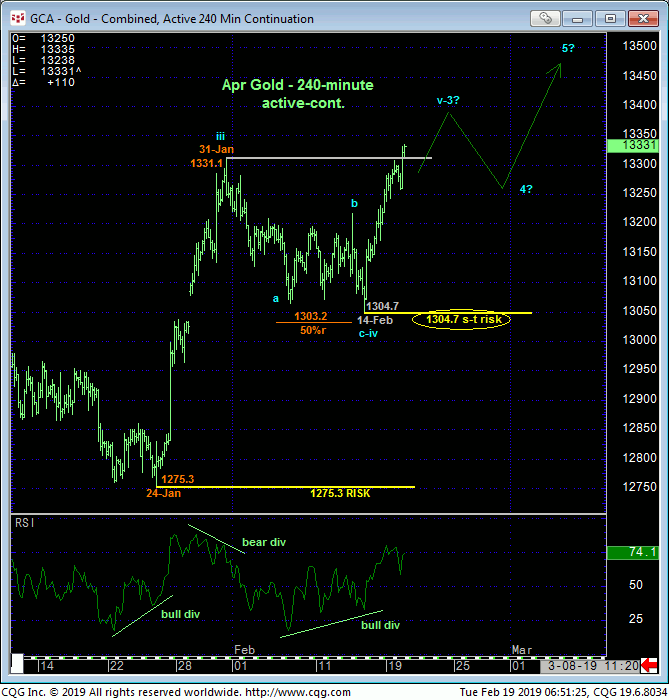
Overnight’s recovery above 31-Jan’s 1331.1 high and our short-term risk parameter nullifies early-Feb’s bearish divergence in short-term momentum and chalks up this month’s sell-off attempt to 14-Feb’s 1304.7 low as a 3-wave and thus corrective event consistent with a resumed broader bullish count. Per such, last week’s 1304.7 low is considered our new short-term risk parameter from which non-bearish decisions like short-covers and resumed bullish punts can be objectively rebased and managed by shorter-term traders with tighter risk profiles.


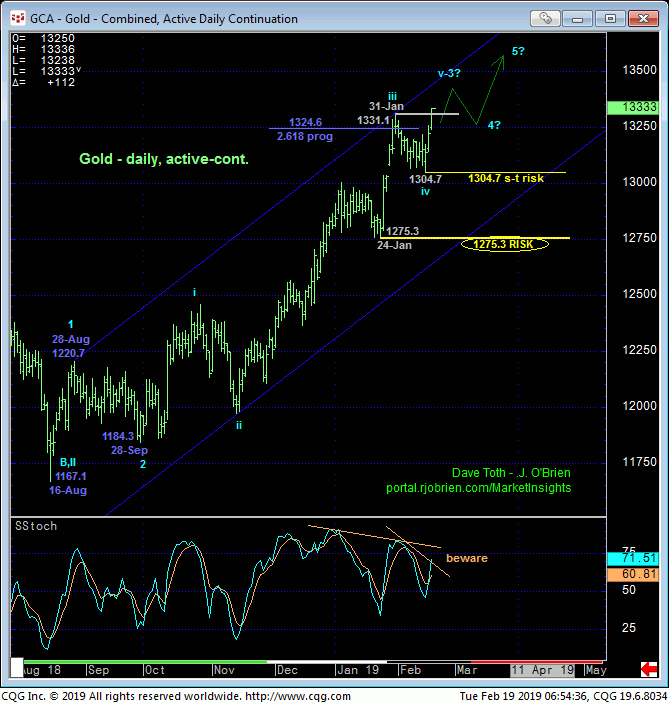
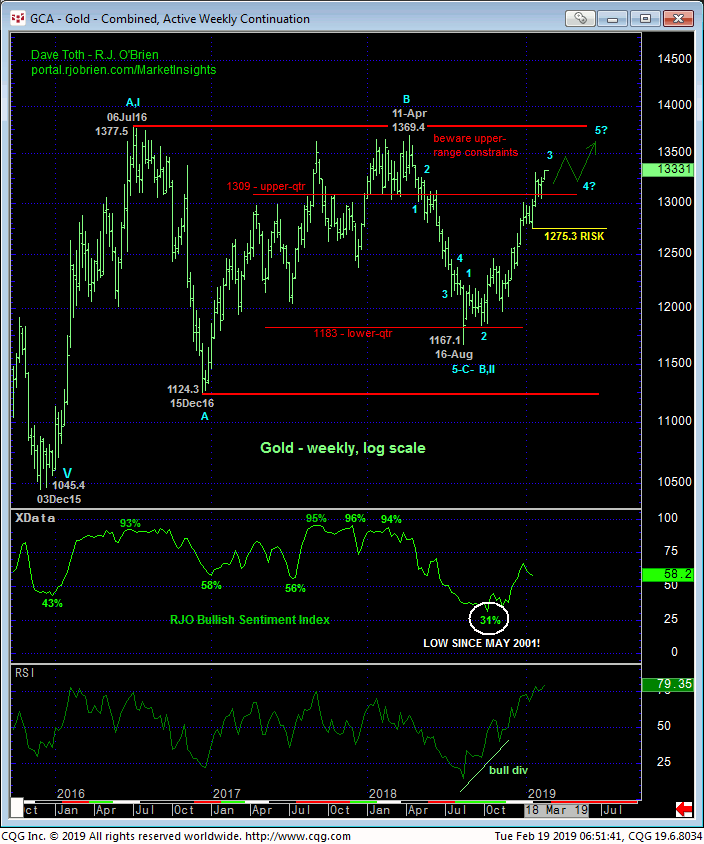
The daily chart above and weekly log chart below show today’s resumption of the impressive, impulsive uptrend from 16Aug18’s 1167.1 low that continues to engage the upper-quarter of the past 2-1/2-YEAR range that has thus far repelled all rally attempts over this time. If there’s a time and place for the bull to fail again, it is here and now and we will gauge such a failure and odds of another intra-range relapse by whether or not the market SUSTAINS gains above recent corrective lows like 24-Jan’s 1275.3 larger-degree corrective low and key risk parameter and even last week’s admittedly smaller-degree corrective low at 1304.7. Until and unless such weakness is shown, there’s no way to know that the current rally isn’t THE rally that will break the 1377 upper-boundary of the 2-1/2-year range and confirm our very long-term base/reversal count.

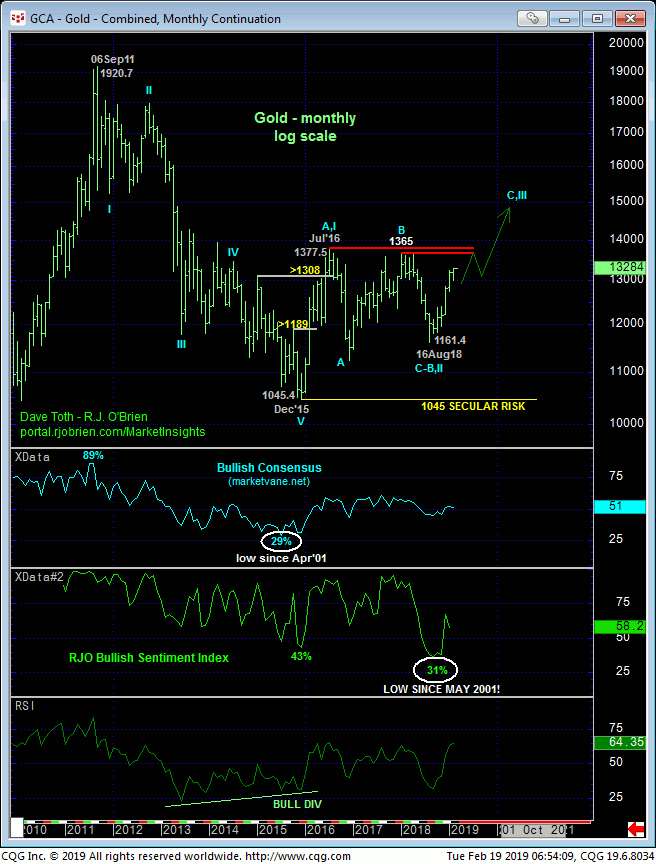
Indeed, long-term players are reminded of the extent and impulsiveness of Dec’15 – Jul’16’s rally that broke the secular bear trend and first exposed a major base/reversal environment. Per this count and as we’ve discussed many times since 4Q16, the sell-off attempt from Jul’16’s 1377 high is considered a (B- or 2nd-Wave) correction of the early-2016 rally within a huge, multi-year BASE/reversal count that calls for potentially steep gains above Jul’16’s 1377 initial counter-trend high. Perhaps this current uptrend is THAT uptrend that busts out above 1377 in the months or perhaps even weeks ahead.
These issues considered, long-term players remain advised to maintain a bullish policy with a failure below 1304.7 required to pare this position to more conservative levels and commensurately larger-degree weakness below 1275.3 to jettison the position altogether. Shorter-term traders with tighter risk profiles whipsawed out of bullish exposure following early-Feb’s bearish divergence in mo are advised to resume a bullish policy and first approach setback attempts to 1330 OB as corrective buying opportunities with a failure below 1304.7 required to negate this call and warrant its cover. In lieu of such sub-1304.7 weakness further and possibly accelerated gains are expected.


