Posted on Sep 28, 2022, 09:02 by Dave Toth
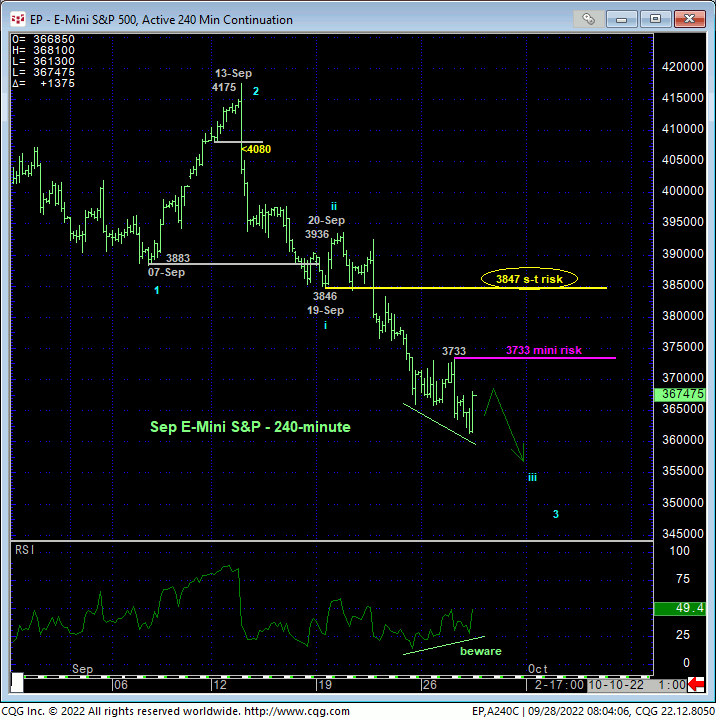
Yesterday and overnight’s continued weakness detailed in the 240-min chart below is consistent with and reinforces our long-term bearish count and identifies yesterday’s 3733 high as the latest smaller-degree corrective high and mini risk parameter from which short-term traders can objectively rebase and manage the risk of a still-advised bearish policy and exposure.
Going up a level of scale, 19-Sep’s 3846 low is considered a minor 1st-Wave down of the resumed secular bear trend from 13-Sep’s 4175 high. A corrective whipsaw hiccup above an extraordinarily tight corrective high like 3733 is one thing. But at this stage of the plunge, and a plunge we believe has miles to go, a recovery above an area of former support-turned-resistance like 3847 would jeopardize the impulsive integrity of a more immediate bearish count enough to warrant paring bearish exposure ahead of what could be a more protracted bear market corrective rebound. Per such, this 3847 is considered our new short-term bear risk parameter pertinent to most traders.
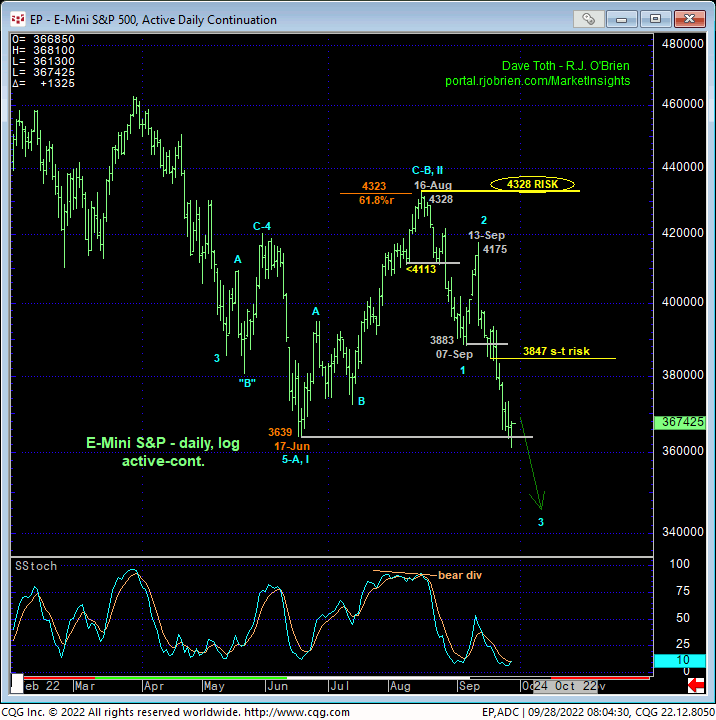
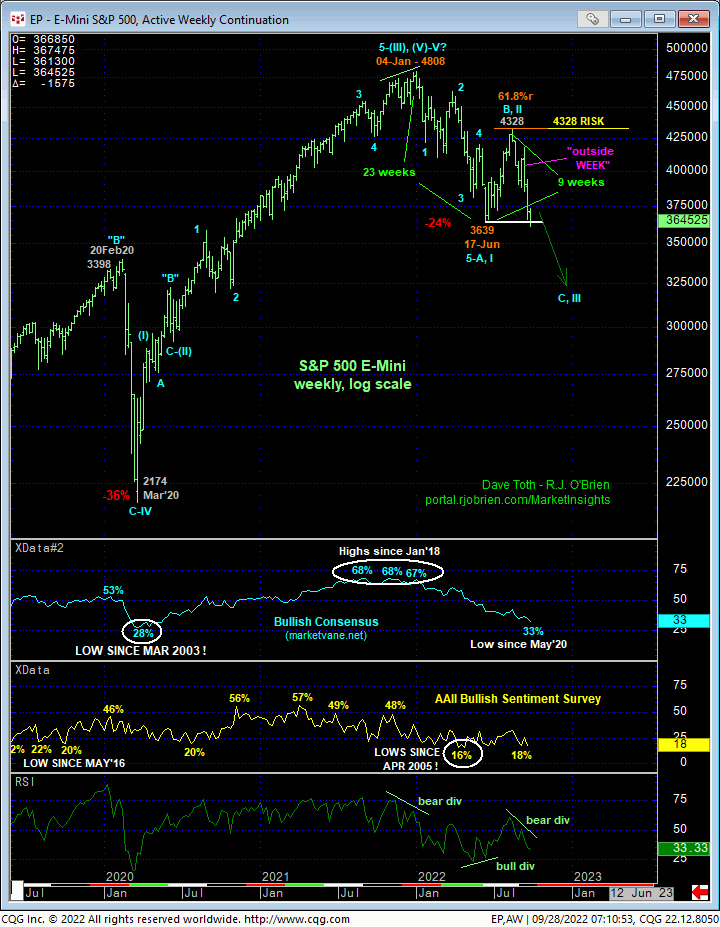
On a broader scale, both the daily (above) and weekly (below) log scale charts show overnight’s break below 17-Jun’s key 3639 low that, in fact, resumes and reinforces our long-term bearish count. Since 24-Jun’s bullish divergence in momentum discussed in that day’s Technical Blog arrested Jan-Jun’s swoon and exposed a bear market correction, we have highlighted and emphasized 17-Junb’s rejected 3639 low as THE low this market needed to relapse below to reinforce and resurrect our secular bearish count. The prospect of such a bear resumption increased with 24-Aug’s bearish divergence in momentum stemming Jun-Aug’s correction, but the extent and impulsive MANNER of the past month-and-a-half’s subsequent weakness provides the real reinforcing evidence of the resumed long-term bear count.
We say this because that specific 3639 level has arguably become less relevant than this entire year’s broader bearish behavior. Indeed, the Dow closed last Fri below its 29,889 low weekly close from 17-Jun. Other indexes like the Nasdaq and Russell have yet to do so. Relative to everything that has transpired this year- a trendy, impulsive Jan-Jun decline, a 2-month 61.8% retracement/correction, and a resumed trendy, impulsive resumption of Jan-Jun’s INITIAL (1st-Wave) decline- we believe every index’s mid-Jun low is less relevant than the overall bear market. We don’t want to miss the proverbial major bear market forest through the mid-Jun low trees.
What’s more important “down here”, whether an index has broken its mid-Jun low or not, is continued trendy, impulsive performance lower. And we will now gauge this performance and manage bear risk around levels like 3733 (very tight) and 3847.
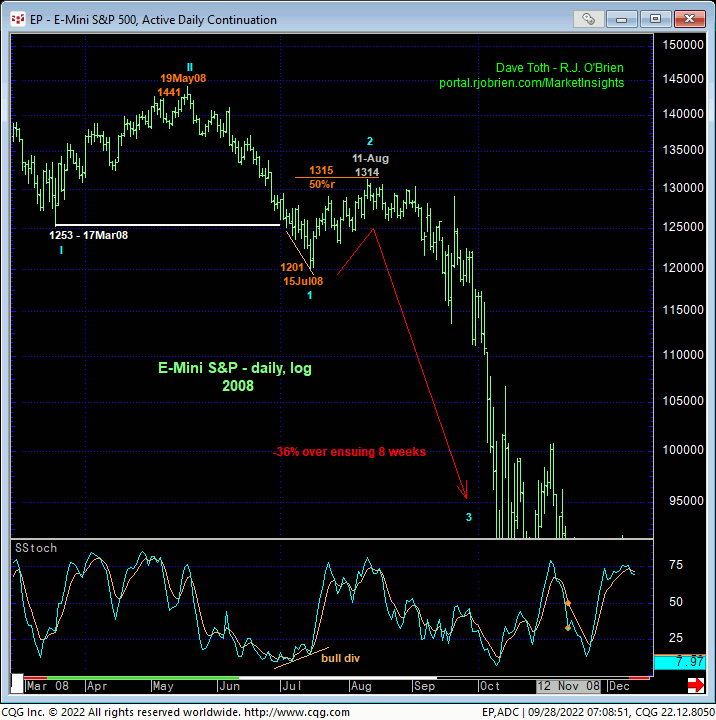
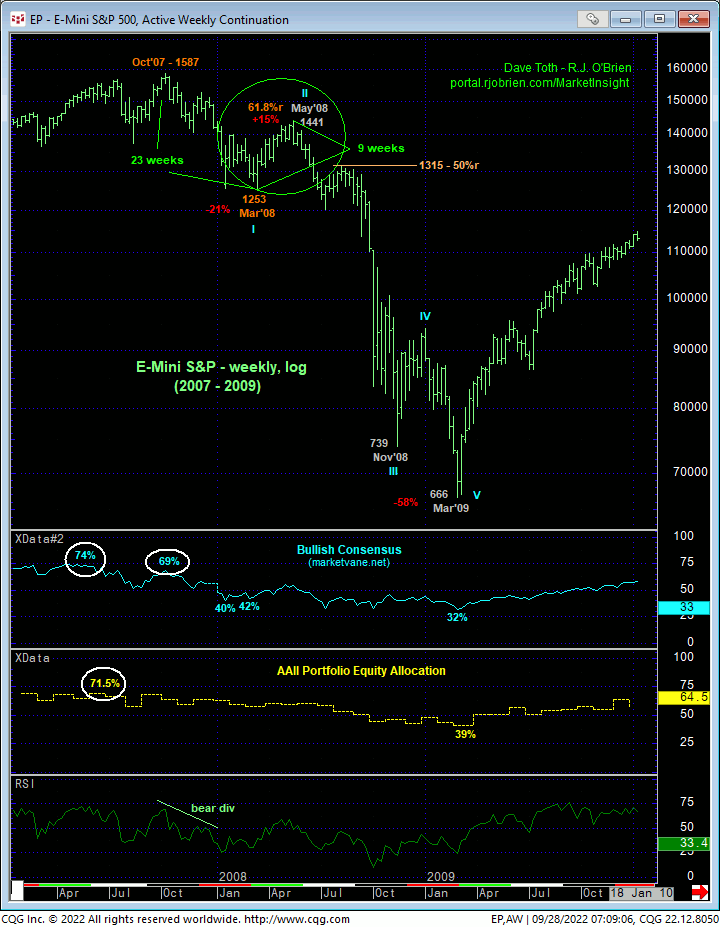
At this point, given the resumption/reinforcement of the secular market, it might be helpful to revisit 2007 – 2009’s major bear market in which the S&P loss 58% of its value over a 17-month period. Thus far, this year’s price action is a virtual mirror image of Oct’07 – Jun’08 price action. After the initial break of Mar’08’s 1253 initial counter-trend low that, in fact, reaffirmed that secular bear trend, the market oscillated sideways with some short-term whipsaw risk before resuming the bear trend to 15Jul08’s 1201 low.
After reaffirming the secular bear trend however, the market then confirmed a BULLISH divergence in daily mo that exposed an exact 50% retracement of May-Jul’08’s 1441 – 1201 decline to a corrective high of 1314 that spanned a MONTH before the rest of the dramatic 3rd-Wave deluge saw this market lose 36% over a concentrated 2-month period.
The key takeaway here is that WITHIN a 17-month, 58% drawdown, a majority of the bear (36%) took place in a very concentrated 8-week period. The entire 17-month bear trend included numerous corrective hiccups all along the way. Heading forward over the next year or so, traders should fully include and anticipate such corrective rebounds and selling opportunities within a secular bear trend that we believe could produce at least a 40%-to-50% drawdown from Jan’s 4808 high over the course of the next year or so.
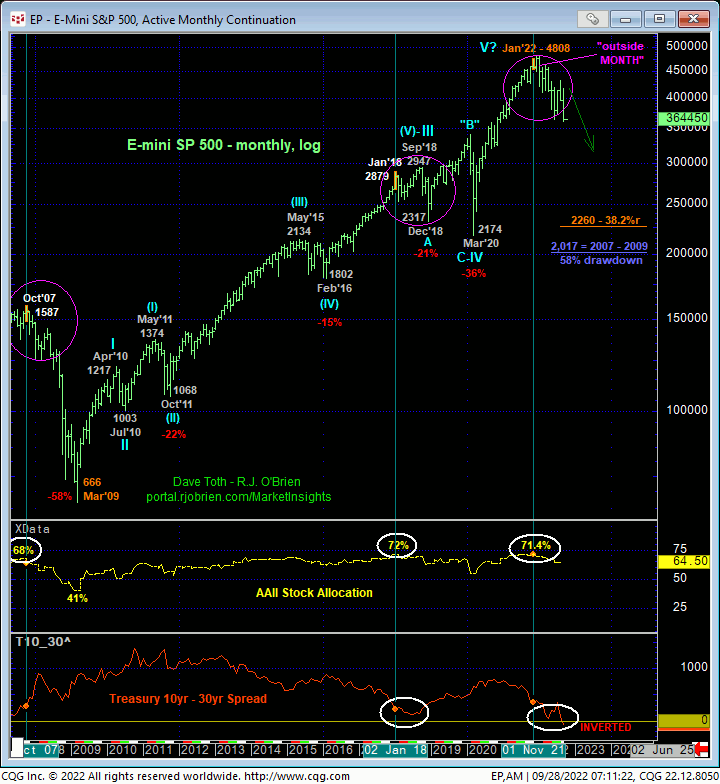
The monthly log chart below reiterates the long-term elements on which our major bearish count remains predicated:
- bearish divergence in monthly momentum
- “outside week, month and QUARTER”
- historically frothy bullish sentiment (i.e. Bullish Consensus, stock and stock-to-cash portfolio asset allocation)
- complete and massive 5-wave Elliott sequence up from 2009’s 666 low
- flattening-to-inverted Treasury yield curve.
These same factors warned of an accompanied 2018 – 2020’s major correction/consolidation and both the 2007 – 2009 and 2000 – 2002 major bear markets.
These issues considered, a bearish policy and exposure remain advised with a recovery above 3847 required for shorter-term traders to pare or neutralize exposure ahead of a more protracted corrective rebound. Very short-term traders may use 3733 as a mini bear risk parameter, which also assumes short-term whipsaw risk. For long-term traders and investors, commensurately larger-degree strength above 16-Aug’s 4328 larger-degree corrective high and key long-term risk parameter remains required to negate this long-term bearish count and warrant moving back to a neutral-to-cautiously-bullish stance. In lieu of such strength or possibly weeks of broader basing/recovery behavior, a major bear market meltdown remains fully expected.
