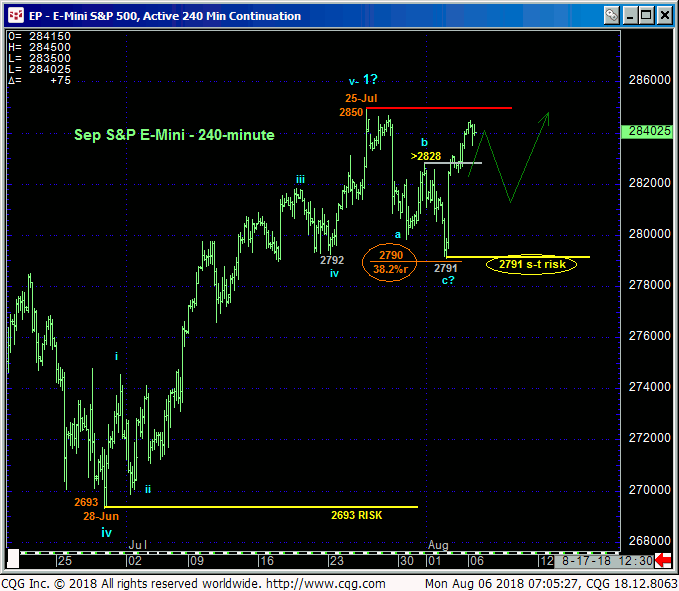
In Thur’s Technical Blog we discussed a bearish divergence in admittedly short-term momentum from the extreme upper recesses of this year’s range that warned of an interim correction that could be relatively deep but well within the confines of this year’s broader (bull market) corrective range. Per this interruptive corrective count we identified 31-Jul’s 2828 minor corrective high that we believed the market needed to sustain losses below to maintain that count. The 240-min chart below shows that by later that Thur afternoon and then into Fri, the market recovered above that 2828 level. Since 25-Jul’s 2850 high remains intact, we cannot say that this rebound negates an interim corrective count altogether, but
- for ancillary sentiment reasons we’ll discuss below
- the 3-wave and thus corrective structure of the recent 2850 – 2791 setback and
- the market’s rejection of the Fibonacci minimum (2790) 38.2% retrace of Jun-Jul’s 2693 – 2850 rally,
we advise traders to consider Thur’s 2791 low as the end or lower boundary to another correction ahead of an eventual resumption of not only the rally from 28-Jun’s 2693 low, but also the secular bull trend to new all-time highs above 29-Jan’s 2879 all-time high.


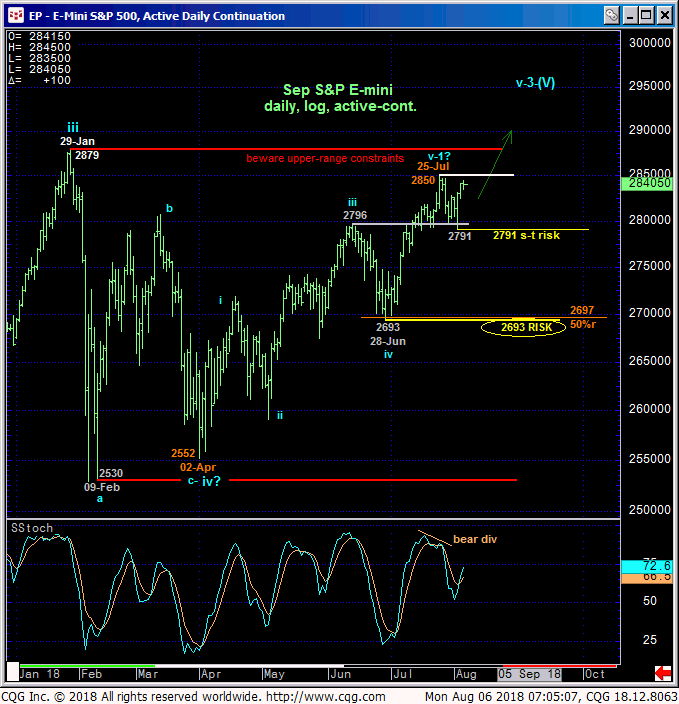
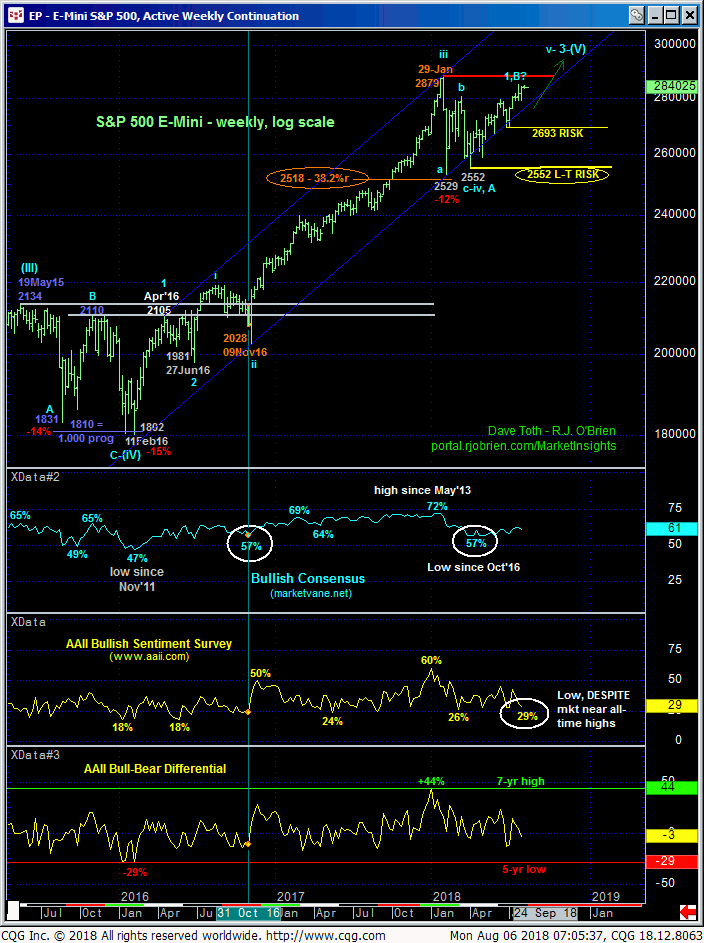
The daily log scale chart above shows the market still below the upper recesses of this year’s range that cannot be ignored as key resistance that can continue to cap the bull for “x-amount” of time. HOWEVER, subdued bullishness in the Bullish Consensus (marketvane.net) measure of sentiment and especially a return to the LOWER recesses of the contrary opinion range of the American Association of Individual Investors survey of bulls DESPITE a 4-MONTH rally warns us of potential UPSIDE VULNERABILITY immediately ahead. And upside that could be “obvious” and impulsive in its blast above Jan’s all-time high. To mitigate this resumed bullish count, all the bear has to do is fail below our short-term risk parameter at 2791.

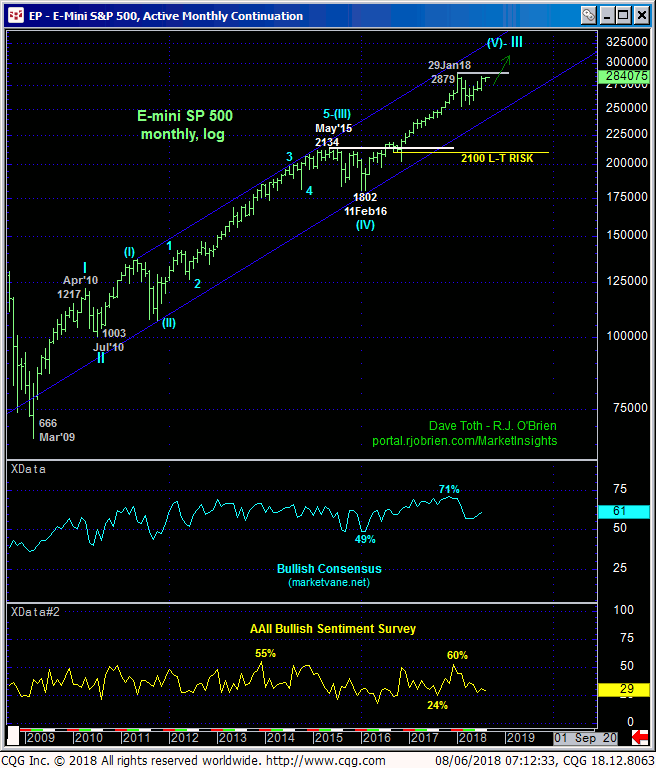
Finally, in an even longer-term perspective, the monthly log scale chart below shows the clear and present and secular bull trend. There is no technical question about this. And the fact that the huddled masses indicated by the AAII survey are biased towards the bear side plays perfectly into the resumed bull’s hand. And as the consensus swarms back to the bull side once the market breaks out, this will likely exacerbate the rally.
These issues considered, a bullish policy and exposure remain advised to longer-term players with a failure below 2791 required to pare bullish exposure to more conservative levels and commensurately larger-degree weakness below 28-Jun’s next larger-degree corrective lows required to defer or threaten a long-term bullish call enough to warrant moving to the sidelines. Shorter-term traders whipsawed out of bullish exposure as a result of Thur’s bearish divergence in short-term mo are advised to wait for a setback to the lower-quarter of the past couple weeks’ 2850 – 2791-range to re-establish bullish exposure and/or buy on the immediate break above 2850. A failure below 2791 is required to negate this cal and warrant its cover.


