Like the energy sector that, generally speaking this year, has had a fairly positive correlation with the S&P 500 Index (as opposed to the NASDAQ that has gone on to new all-time highs), the S&P has been laboring in its rally attempt up against some very notable resistance. Not a whole lot has changed since 16-Jun’s Technical Blog update when the market held support where it was expected to and defined 15-Jun’s 2923 low that, by virtue of the extent of the subsequent recovery, now serves as our new key long-term risk parameter to a bullish policy.
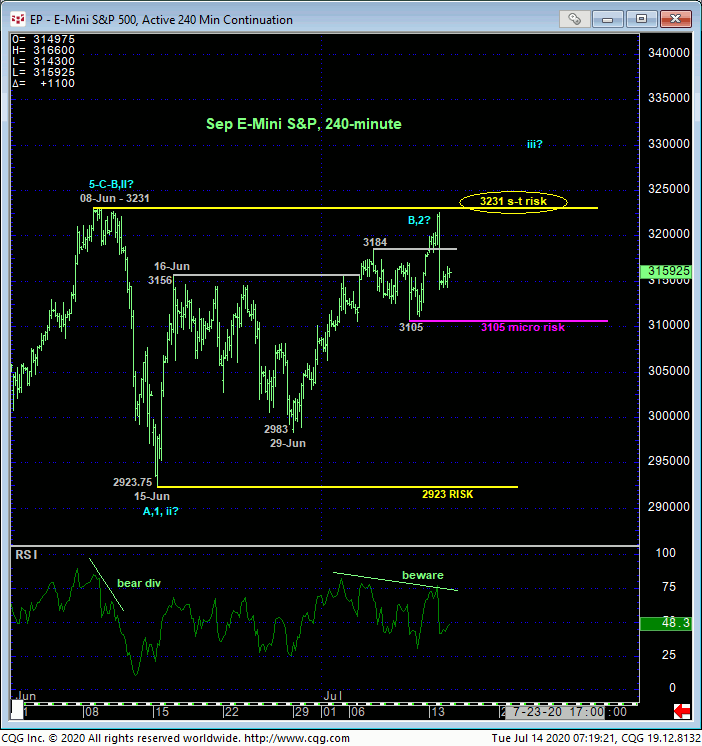
By the same token however, the market has yet to break 08-Jun’s 3231 high and short-term risk parameter left in the wake of early-Jun’s bearish divergence in short-term momentum. And the 240-min chart below shows the past couple weeks’ portion of the recovery really laboring once again, creating the POTENTIAL for another bearish divergence in momentum.
Yesterday’s resumed rally leaves last Thur’s 3105 low in its wake as the latest smaller-degree corrective low the market must now sustain gains above to maintain a more immediate bullish count. Its failure to do so will CONFIRM the momentum failure, break the uptrend from at least 29-Jun’s 2983 low and expose at least another intra-5-week-range relapse. But “up here”, so close to market-defined major resistance since 20-Feb’s 3398 all-time high, even a short-term mo failure cannot be ignored as a slip that could morph into a much more protracted decline.

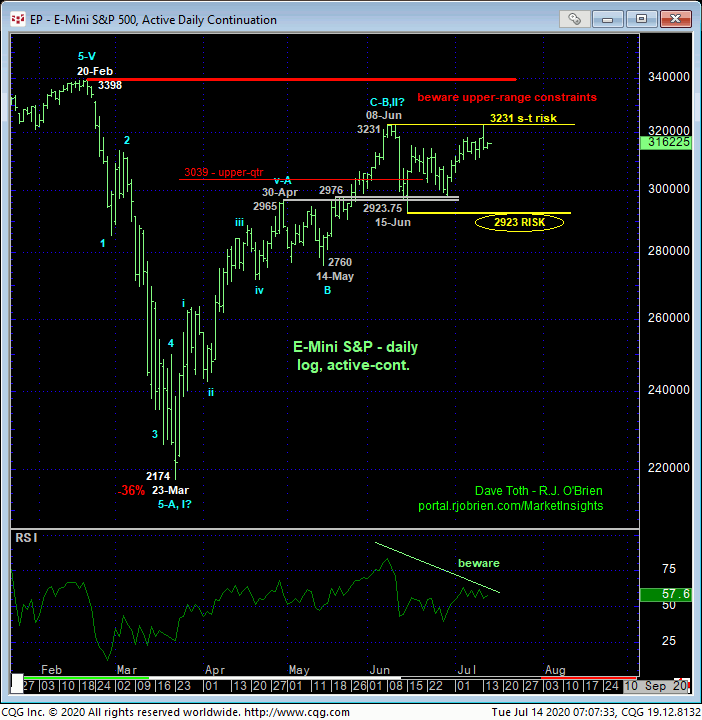
The daily log chart below shows the pertinence of both our key long-term bull risk parameter at 2923 and our short-term but equally critical bear risk parameter defined by 08-Jun’s 3231 high. The fact that that 3231 high specifically, and the past five weeks’ price action in general, reside in the upper-quarter of this year’s range remains a threat to the secular bull market. If there’s a time and place for this thing to fail once again, it is here and now. And we will gauge such a failure first by an admittedly short-term break below 3105 and then certainly by a break below 15-Jun’s hugely important 2923 larger-degree corrective low.
Conversely, a recovery above 3231 will, in fact, reaffirm the major uptrend from 23-mar’s 2174 low and set sights on 20-Feb’s 3398 high, resistance and secular risk parameter it needs to break to reinstate the secular bull market.
We’ve defined four specific levels- 3105, 3231, 2923 and 3398- around which to base directional biases and exposure commensurate with one’s personal risk profile. This market’s likely to do one of two things “up here” (Duh!): continue its bull trend from the Mar low to new all-time highs or fail miserably. Given the importance of this year’s well-market major resistance and the very bearish prospect that this market may still be in a major correction from the Feb high, how it behaves around these specific risk parameters will be critical to getting a leg up on the next directional move commensurate with one’s personal risk profile. And traders of all scales and risk profiles are urged to acknowledge and be flexible to a big move either way.


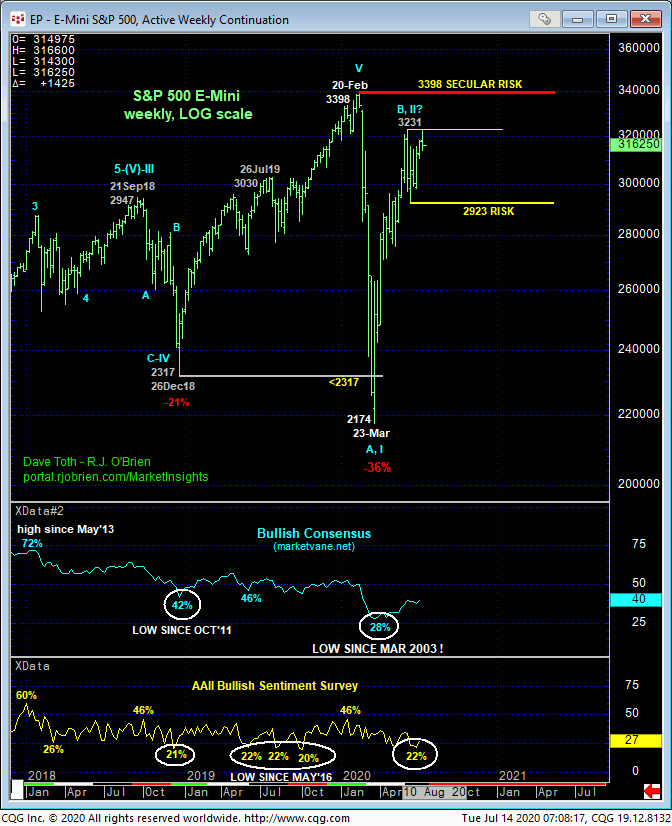
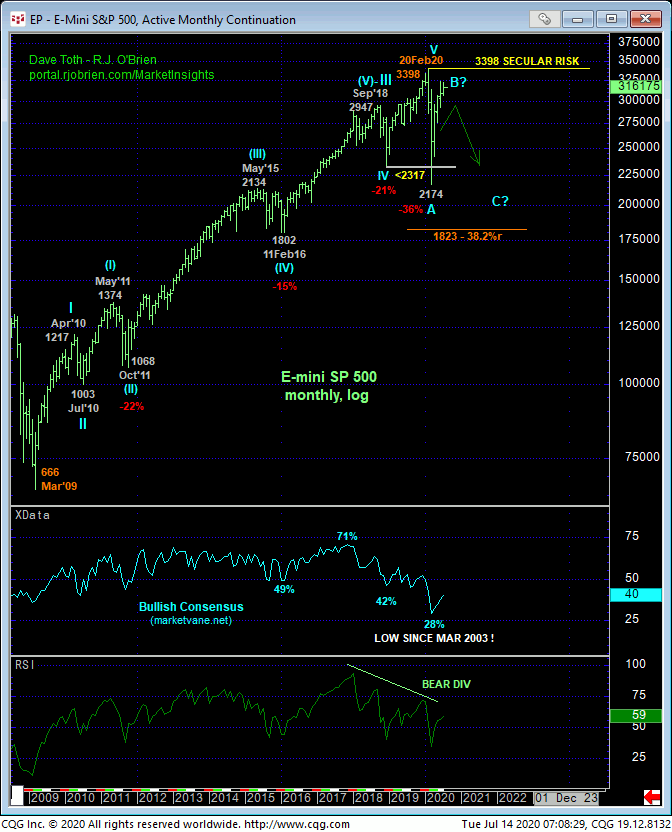
Stepping farther back to consider this year’s incredible price action compared to historical prices, it remains a technical fact that Feb-Mar’s sell-off broke the secular bull trend. To negate this fact and confirm the 36% break from 3398 to 23-Mar’s 2174 low as a violent but complete correction, all the bull has to do is break above 3398. Until and unless such strength is proven, we cannot ignore a still-bearish count that contends that break to 2174 is just the INITIAL (A- or 1st-Wave) of a correction or reversal lower that has a lot more nasty to go.
If a broader peak/correction./reversal is what the market has in store for us, then the current upper-quarter of this year’s range is an extraordinarily dangerous but opportunistic area and condition from which to beware such a relapse that could be massive. And we will gauge such a bearish prospect specifically around the market’s inability to sustain 4-month-uptrend gains above 15-Jun’s 2923 low. Below 2923 is NOT the place to be long for longer-term players, but rather, short ahead of what could be protracted, even relentless losses.
These issues considered, a bullish policy remains OK with a failure below 3105 required for shorter-term traders to move to a neutral-to-cautiously-bearish stance. Long-term players remain advised to maintain a cautiously bullish policy and exposure with commensurately larger-degree weakness below 2923 required to negate this call, warrant its complete and immediate cover and reversal into at least a cautious bearish policy. Resumed proof of strength above 3231 is required to allay or at least defer these peak/correction/reversal concerns.


