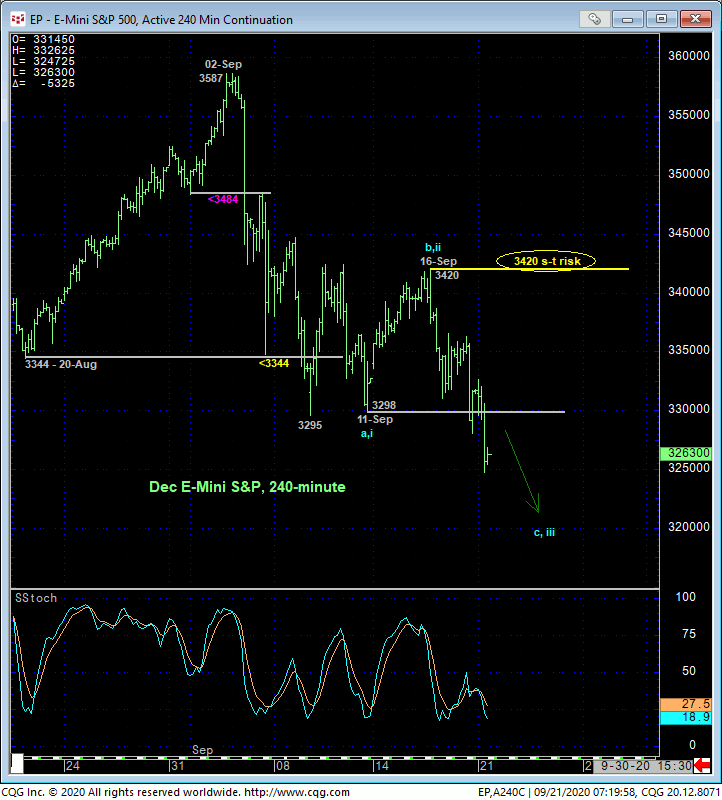

In Thur’s Technical Update we discussed the developing peak/correction/reversal threat that began with 03-Sep’s micro momentum failure below 01-Sep’s 3483 low. Fri’s break below 11-Sep’s 3298 initial counter-trend low is the next reinforcing step to this peak/reversal count and leaves 16-Sep’s 3420 high as the latest smaller-degree corrective high this market is now minimally required to recover above to defer or threaten a bearish count and perhaps resurrect the secular bull market. Until and unless such specific 3420+ strength is shown, at least the intermediate-term trend is down and very possibly a new longer-term downside threat. Per such, this 3420 level serves as our new short-term risk parameter from which shorter-term traders can rebase and manage the risk of an advised bearish policy and exposure and from which longer-term players can base non-bullish decisions like the advised paring of bullish exposure to circumvent developing downside risk.
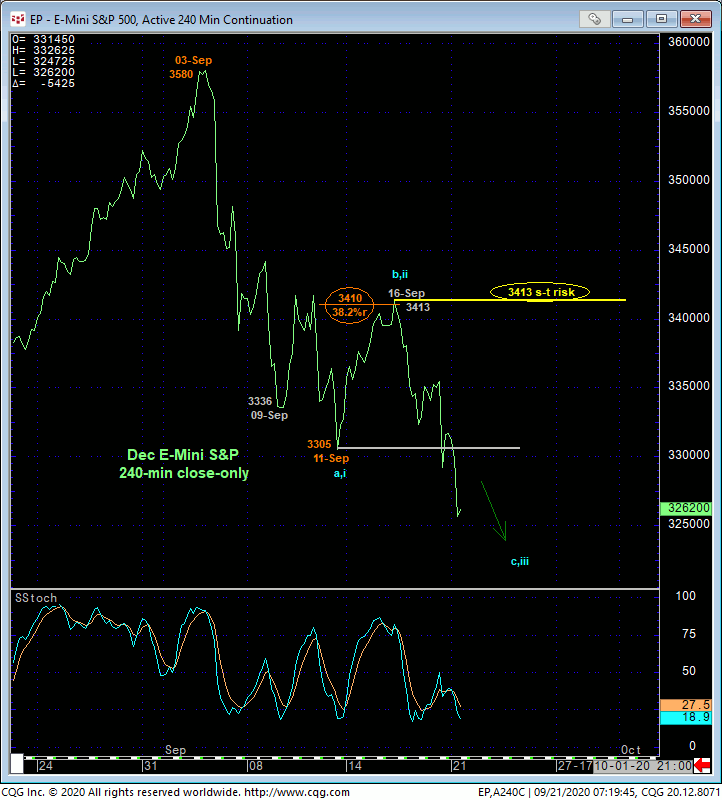
The fact that last week’s recovery attempt retraced only a Fibonacci minimum 38.2% of early-Sep’s 3580 – 3305 decline reinforces this bearish count and 3413-to-3420-area as an effective and objective area from which to navigate lower prices and the risk of non-bullish decisions like long-covers and new bearish exposure.

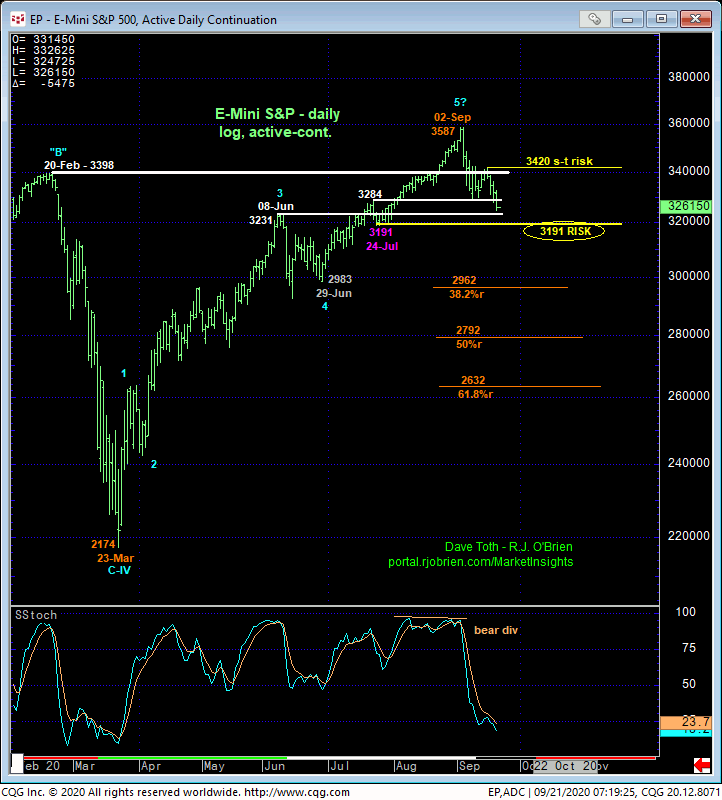
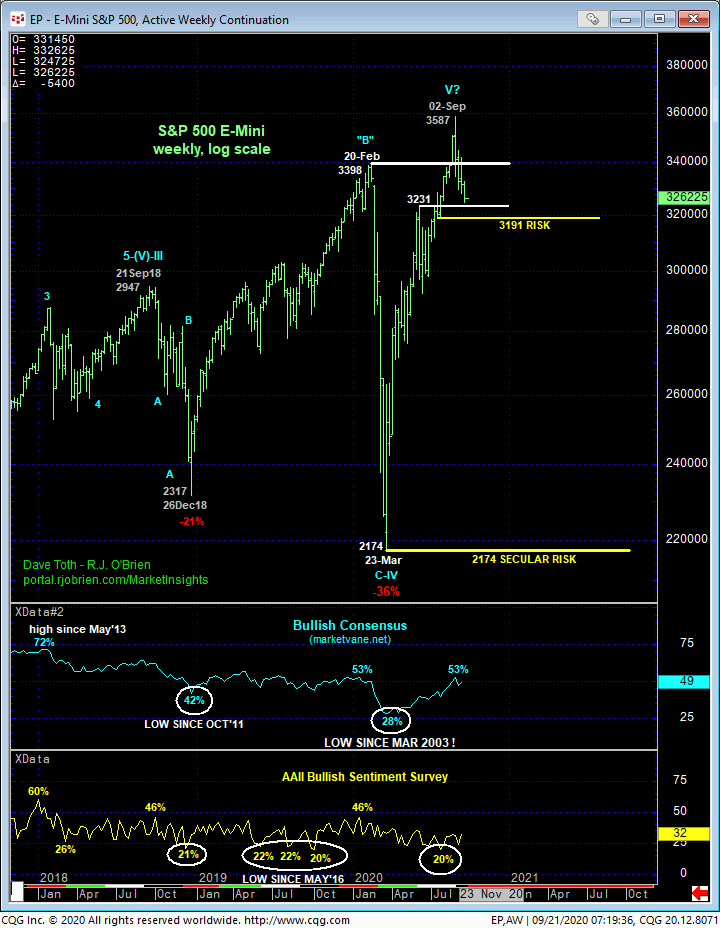
Stepping back to consider Mar-Sep’s impressive, impulsive rally that overtook 20-Feb’s 3398 previous all-time high on a daily log scale basis below, the market’s failure to SUSTAIN gains above that former 3398 high is not the end-all t the bull, but it’s not the price action needed to maintain confidence in the risk/reward merits of a bullish policy “up here”. For weeks now, we have specified this range from that former all-time high at 3398 to 08-Jun’s 3231-area high and former resistance as a new support area and condition the bull would be expected to sustain gains above to maintain a longer-term bullish count. We have also specified 24-Jul’s 3191 low as the specific larger-degree corrective low that, if broken, would break at least the uptrend from 29-Jun’s 2983 low and very possibly end a 5-wave Elliott sequence up from 23-Mar’s 2174 low. Fri and today’s resumed intermediate-term weakness is the next verifiable step that raises the odds of that larger-degree momentum failure below 3191. And one below that threshold, the market’s downside potential is indeterminable and potentially severe.
Again, in the days leading up to 25-Feb’s momentum failure below 31-Jan’s 3212 larger-degree corrective low that we identified with the exact same technical discipline as we’re now identifying 24-Jul’s 3191 low, we stated that all bullish exposure should be covered as there was no way to know the market’s downside potential. We did not forecast such an immediate, relentless meltdown. Once the market broke 3212, the rout was on and bulls that didn’t neutralize bullish exposure were left with only “hope” for the market to rebound. And as we’ve stated often in this blog, hope is not an investment strategy.

The market’s downside potential below 3191 is indeterminable and potentially severe. What we have and will be able to state with confidence and specificity is where the developing bear trend would/should NOT be able to trade above per any broader bearish count: 3420 currently and then certainly not above 02-Sep’s 3587 all-time high.
In the daily chart above we’ve noted that even a Fibonacci minimum 38.2% retrace of Mar-Sep’s 2174 – 3587 rally doesn’t cut across until the 2960-area. But as with ALL merely “derived” levels like Bollinger Bands, trendlines, imokus and the ever-useless moving averages, even our vaunted Fibonacci relationships have NEVER proven to be reliable reasons to expect support (or resistance) without an accompanying confirmed bullish (in this case) divergence in momentum. And they never will. So expecting that Fib retrace to hold as support is subjective and flat out wrong.
If the market breaks 3191, a correction or reversal that may be protracted in scope will be exposed. We’ve always abided be two industry sayings:
- the trend is your friend and
- better being out, wishin’ you were in, than in, wishin’ you were out.
If a sub-3191 “failure” proves to be only a whipsaw, fine; the market will have left corrective highs and risk parameters on the way down like 3420, above which, bullish exposure can be objectively re-established. NOT neutralizing bullish exposure on a sub-3191 leaves the trader/investor subject to whatever downside the market has in store. And t think that another Feb-Mar meltdown, OR WORSE, cannot lie ahead would be a subjective and potentially extraordinarily costly decision.
These issues considered, shorter-term traders remain advised to maintain a bearish policy and exposure with a recovery above 3420 required to negate this call and warrant its cover. Longer-term players are advised to pare bullish exposure even further and jettison remaining exposure altogether on the immediate failure below 3191. The market’s downside potential thereafter would be indeterminable and potentially severe. “Hope” for the bull to resume following such a sub-3191 failure is not an objective investment strategy unless you’re accepting secular bull market risk to levels below 23-Mar’s 2174 low.


