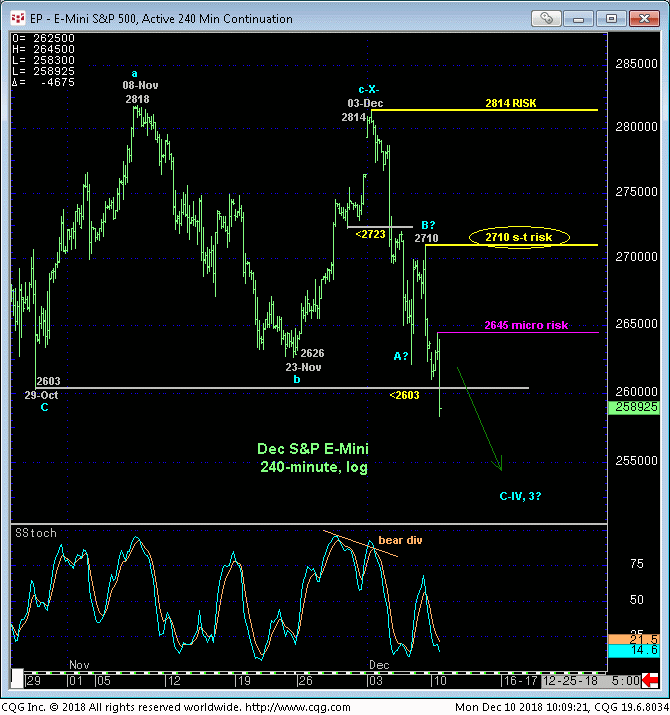
This morning’s break below 29-Oct’s 2603 low and pivotal long-term risk parameter reinstates a peak/reversal threat started with Sep-Oct’s 13% plunge from 2947 to 2603. This weakness confirms our bearish count discussed in Thur’s Technical Blog following 04-Dec’s short-term mo failure below 2723 and exposes potentially severe, even relentless losses straight away.
The important by-product of this resumed weakness is the market’s definition of corrective highs ranging from as tight as overnight’s 2645 high detailed in the 240-min chart below to last Mon’s new critical larger-degree corrective high at 2814 that serves as THE KEY risk parameter this market is now required to recoup to mitigate a major correction/reversal lower and re-expose the secular bull. Until and unless such 2814+ strength is proven, the trend is DOWN on a broader scale and exposes indeterminable losses below.
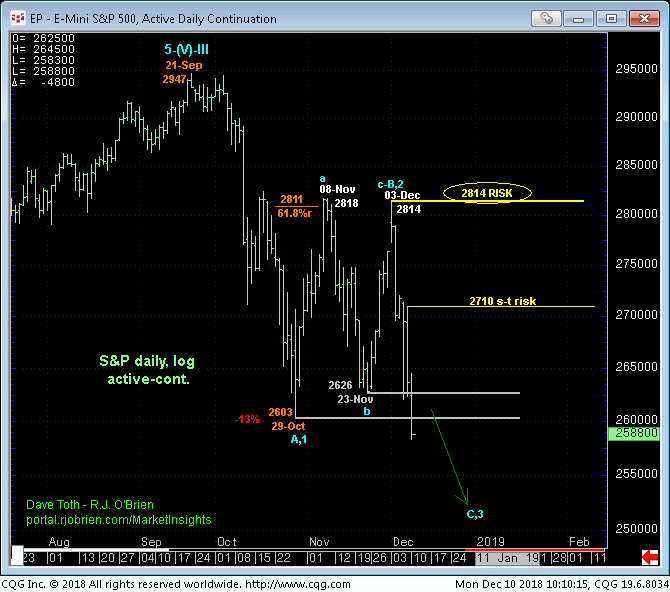
Today’s break below 29-Oct’s 2603 low confirms 29-Oct-to-03-Dec’s recovery attempt as a textbook 3-wave and thus corrective structure that satisfies the critical third of our three key reversal requirements. The new major trend is, in fact, down and should not surprise by its continuance or acceleration with, specifically, a recovery above 2814 required to negate this call.
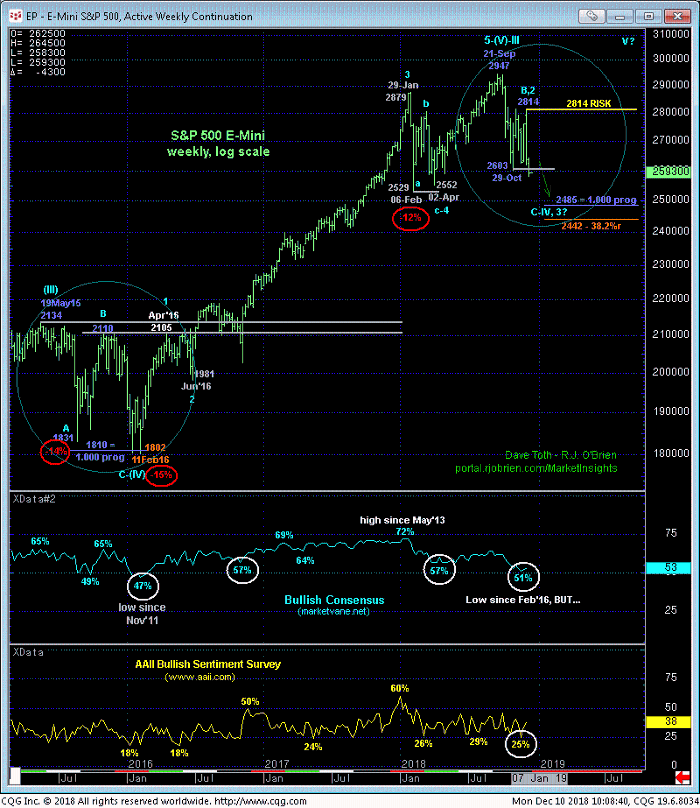
On a weekly log scale basis below this morning’s resumption of Sep-Oct’s decline resurrects AT LEAST a correction of the entire 5-wave rally from Feb’16’s 1802 low to 21-Sep’s 2947 all-time high, the Fibonacci minimum 38.2% retracement of which doesn’t cur across until the 2442-area. As another “derived” reference point (for what they’re worth….which is NOTHING in the absence of a countering bullish divergence in mo), the 1.000 progression of sep-Oct’s 2947 – 2603 decline from 03-Dec’s 2814 high cuts across at 2485.
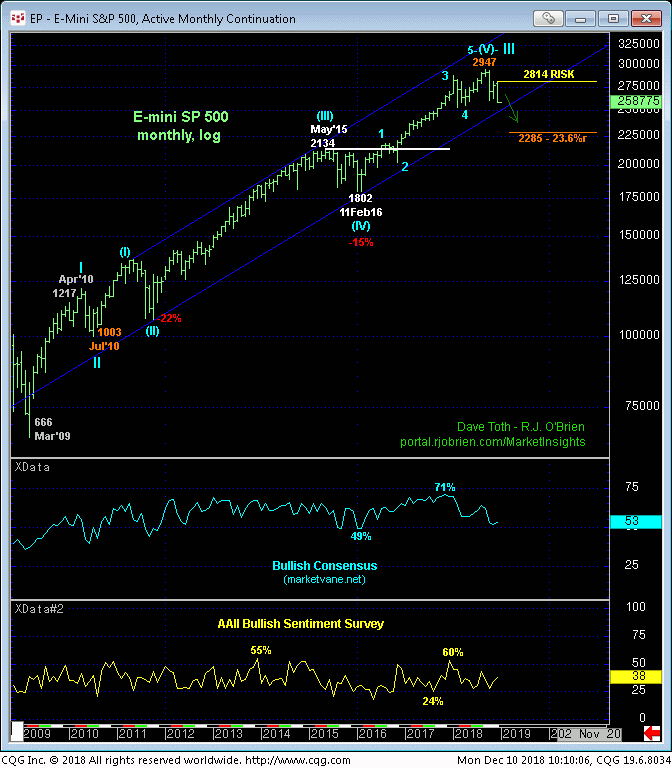
The REAL threat is that this market could be correcting an even broader 5-wave sequence up from Jul’10’s 1003 low shown in the monthly log chart below that, if correct, could easily produce losses to the 2100-handle-area or lower. The bottom line is that the market’s downside potential is indeterminable and potentially severe, possibly lasting months or even quarters more. What is exact is the RISK of non-bullish decisions like long-covers and new bearish punts: 2814.
As we’ve recently discussed, market sentiment levels have been and remain at historically low, pessimistic levels typical of broader BASE/reversal-threat conditions. But traders are reminded that sentiment/contrary opinion is not an applicable technical tool in the absence of a confirmed bullish divergence in momentum needed to stem the clear and present downtrend.
There’s no way to know whether this market has steep, multi-month losses immediately ahead or if this downtrend will bottom tomorrow. What we know with specificity is what the market has to do to threaten the bear and tilt the directional scales back to the bull side: recover above 2645 to start, then above 2710 and finally above 2814. Until the market proves such strength, there is currently no technical reason to approach this market from anything but at least a neutral stance if not an aggressively bearish one.
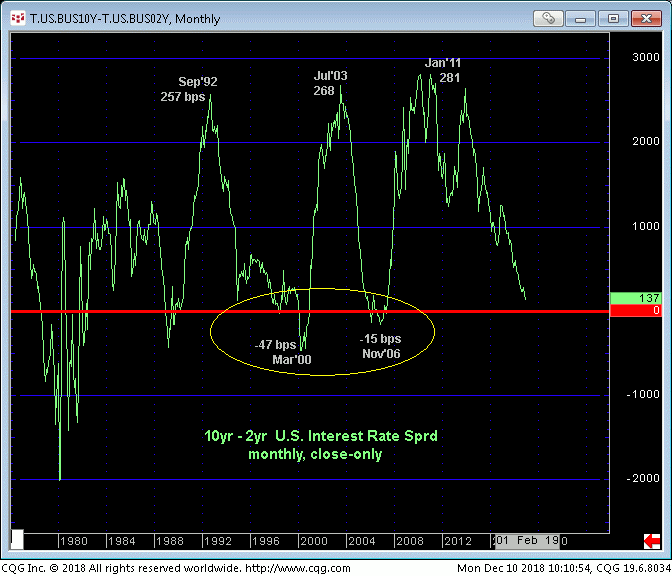
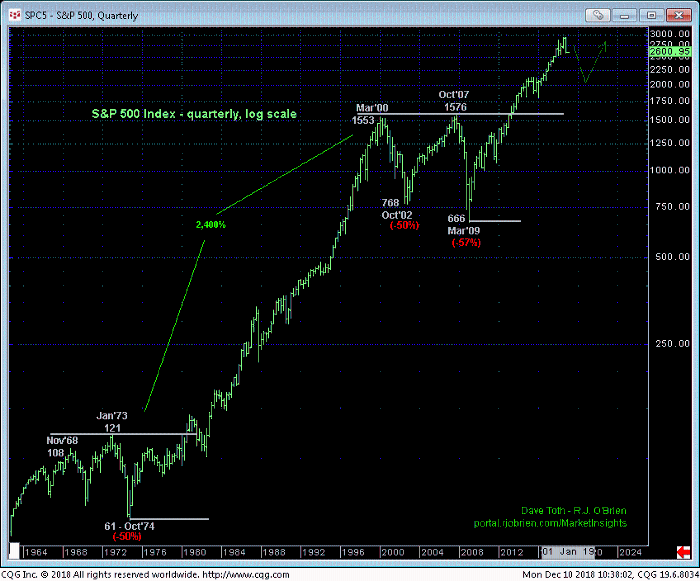
Finally, we have updated major BASE/reversal calls in the 10-Yr T-Note, Dec19 Eurodollar and gold markets of late, all quality-flight vehicles investors turn to in times of equity market duress and fear. The 2-yr/10-yr Treasure yield spread above is yet further compelling and reinforcing evidence of a major correction or reversal in the equity markets. This curve’s narrowing to the point of inversion in late-1999 and also 2006 preceded MAJOR peak/reversals in equities in Mar 2000 and Oct 2007, respectively, in the quarterly log chart below.
We are not saying this current correction or reversal threat will be as bad as either of those prior 2-year calamities. But until and unless the market stems the current, clear and present downtrend with proof of strength above the specific levels we identified above, there really is no way to know how far down “down” is. And “hope” for the correction to not be that bad is not an investment strategy.
These issues considered, shorter-term traders remain advised to maintain a bearish policy with a recovery above at least 2645 and preferably 2710 required to threaten this call enough to warrant its cover. Long-term players have been advised to neutralize all bullish exposure (to eliminate the risk of whatever remaining downside this market has in store) with a recovery above at least 2710 and preferably 2814 required to threaten or negate this bearish call and resurrect the secular bull. In lieu of such strength, look out below!
