SEP E-MINI S&P 500
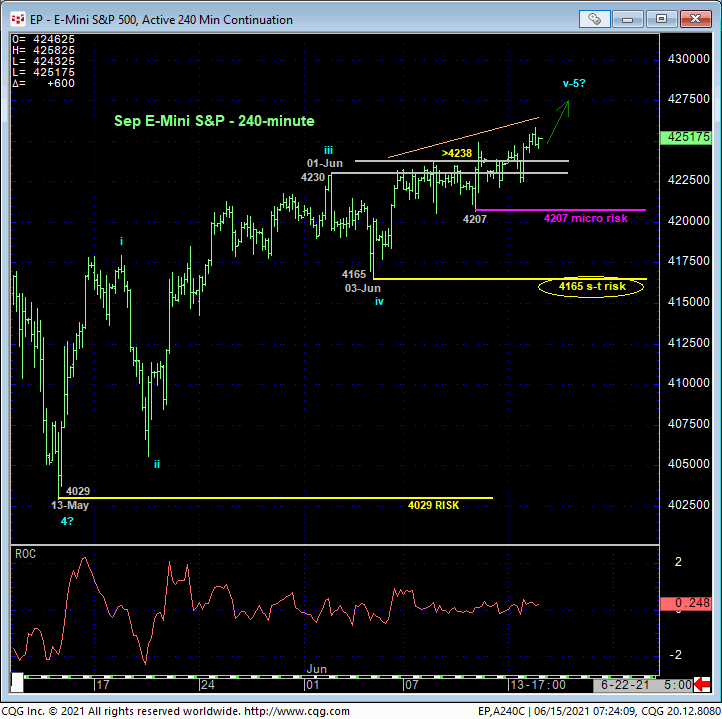
With last Thur’s break above 10-May’s 4230 high, the market has reinstated and reaffirmed the secular bull trend. The trend is up on all scales and is fully expected to continue to behave like a bull by sustaining trendy, impulsive, increasingly obvious price action higher. We gauge this performance, quite simply, by the bull’s ability to maintain prices above prior corrective lows left in the wake of this resumed secular bull trend.
Specifically, the 240-min chart below shows prior corrective lows of various scales defined by last Thur’s 4207 smaller-degree corrective low, 03-Jun’s 4165 intermediate-degree corrective low and certainly 13-May’s 4029 major corrective low. If we’re supposed to maintain a bullish policy (and we are, and an aggressive one at that), then this market should be able to not only sustain this trend above these levels, but continue to “perform” higher. Its failure to do so will confirm bearish divergences in momentum of various scales and defer, threaten and eventually negate the bull to the point of non-bullish action like paring bullish exposure before neutralizing it completely.
As we always discuss, the crucial management of risk comes down to technical and trading SCALE. A micro momentum failure below a smaller-degree corrective low like 4207 is pertinent only to shorter-term traders. Commensurately larger-degree weakness below levels like 4165 and certainly below 4029 is pertinent to longer-term institutional traders and investors. Complicit in effective risk management is understanding and acknowledging that 1) we cannot conclude a major peak/reversal threat from proof of just smaller-degree weakness, but that 2) every larger-degree momentum failure below a level like 4029 starts with a smaller-degree failure below a level like 4207. This risk management preface will become clearer when we relate the current and clear bullish technical construct in the S&P to recent price action in copper below.
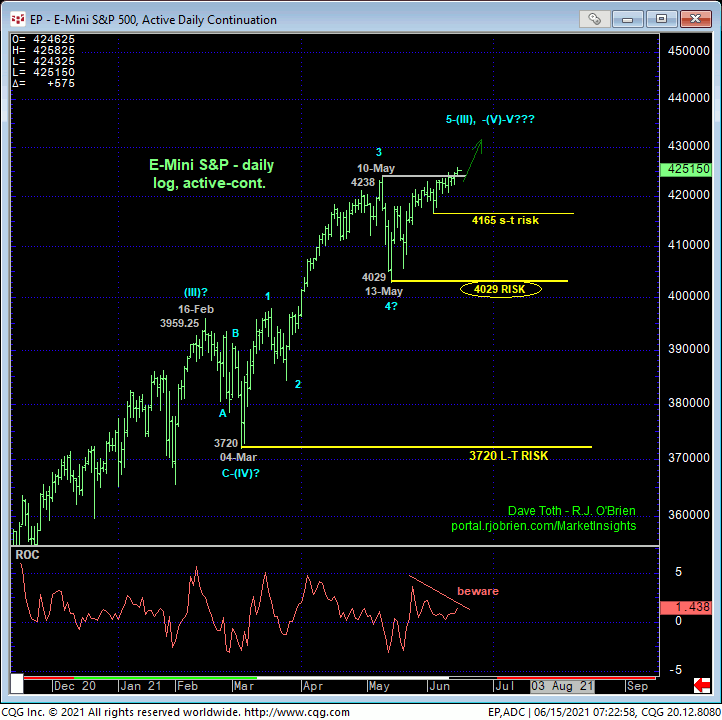
The daily log scale chart below shows the past few days’ reaffirmed secular bull trend. Again, if we’re supposed to be long this market (and we are), it is incumbent on the bull to BEHAVE LIKE ONE by sustaining trendy, impulsive price action higher. the market is above former 4235-to-4225-area resistance that, since broken, should hold as new support ahead of further and expectedly accelerating gains straight away. This daily chart also shows the developing POTENTIAL for a bearish divergence in the rate-of-change measure of momentum. A specific failure below 03-Jun’s 4165 corrective low is required to confirm this divergence threaten the trend and warrant defensive action like paring or neutralizing bullish exposure commensurate with one’s personal risk profile. An admittedly shorter-term momentum failure below 4207 would be an early warning of behavior INconsistent with a more aggressive bullish policy, warranting increased scrutiny of developing threatening conditions and a defensive plan of action. Until weakness below corrective lows and risk parameters is proven, the trend remains up on all scales and there’s no way to know how high ‘high” is.
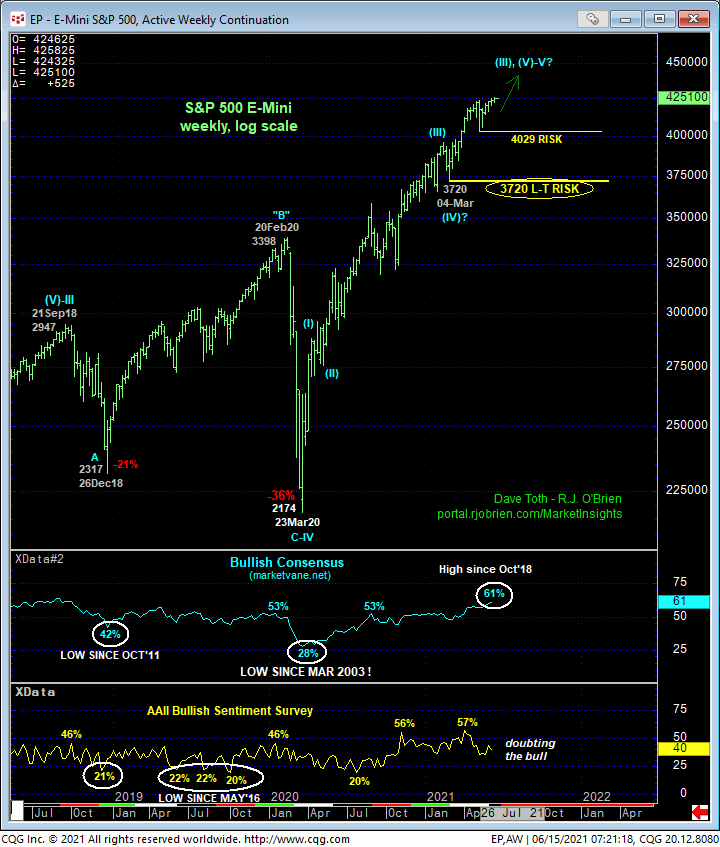
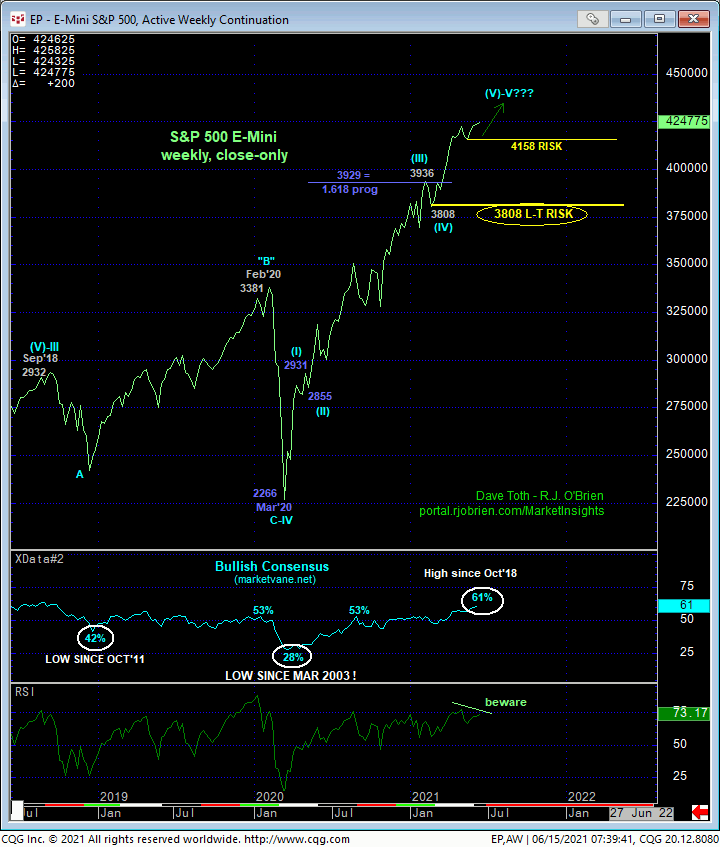
On a broader weekly basis shown in the weekly log chart above and weekly close-only chart below, the trend is clearly up, no question. This warrants a full and aggressive bullish policy and exposure. The Bullish Consensus (marketvane.net) measure of market sentiment/contrary opinion is at a nearly 3-year high and cannot be ignored as a peak/reversal-threat element. By the same token, the AAII Bullish Sentiment Survey has been eroding for the past two months while the bull has continued to perform. This “doubting Thomas” sentiment by the huddled masses may be an extraordinarily BULLISH element at this time as the market rarely rewards these masses at key turning points.
Another threat to the bull is waning upside momentum indicated by the RSI measure of momentum in the weekly close-only chart below. While worth keeping an eye on, of course, this indicator is of no matter until and unless the market CONFIRMS the signal with a close below 21-May’s 4158 corrective low close. This 4158 threshold is analogous to 13-May’s 4029 intra-day corrective low and key longer-term bull risk parameter noted above.
These issues considered, a full and aggressive bullish policy and exposure remain advised with a failure below 4207 required for short-term traders to step aside. Commensurately larger-degree weakness below 4165 is required for intermediate-term traders to move to the sidelines and for longer-term institutional traders and investors to take heed of a broader peak/correction/reversal threat that would warrant paring bullish exposure to more conservative levels. A major momentum failure below 4029 would be considered a significant threat to the secular bull trend that we believe would warrant neutralizing all bullish exposure ahead of a peak/reversal threat of indeterminable scope. Until this market weakens below at least 4207 and preferably 4165, the trend is up on all scales and should not surprise by its continuance or acceleration.
Below, we discuss the goings-on in the copper market, where over the past month, this market has failed below the same type of corrective lows we cited above in the S&P. Per such, copper looks increasingly vulnerable to further and possibly protracted weakness in the weeks and even months ahead. The consistent technical discipline is the same and will help with the objective game plan to effectively manage bull risk in equities.
JUL COPPER
The 240-min chart below shows overnight’s decisive break below the past 3-1/2-WEEKS’ support that reaffirms our peak/correction/reversal-threat count introduced in 14-May’s Technical Blog following 13-May’s bearish divergence in very short-term momentum below 11-May’s 4.6625 initial counter-trend low. This continued weakness leaves Fri’s 4.5950 high in its wake as the latest smaller-degree corrective high this market is now required to recoup to break the downtrend from 10-May’s 4.8880 high and perhaps resurrect the secular bull trend. Until and unless such 4.5950+ strength is shown, the trend is down on most practical scales and should not surprise by its continuance or acceleration.
The market’s rejection of TWO 61.8% retracements within this developing downtrend reinforce a broader peak/reversal threat and a bearish policy. Now-former 4.43-to-4.44-handle-area support serves as a key new resistance candidate.
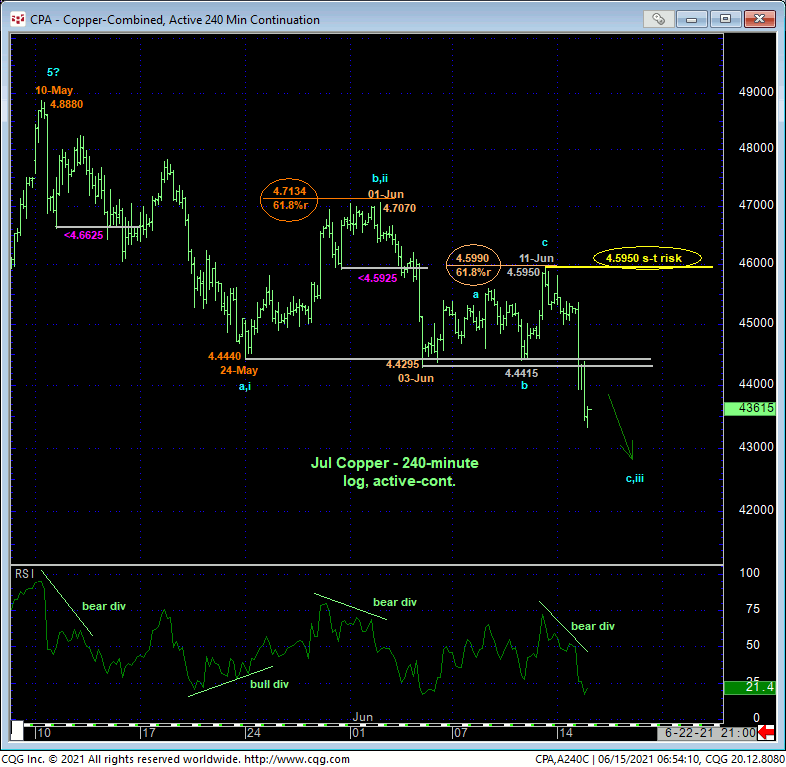
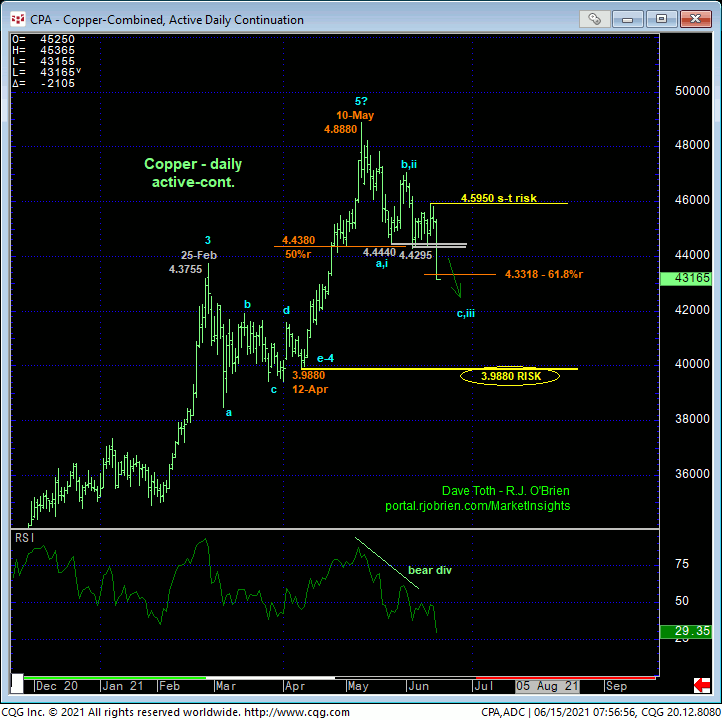
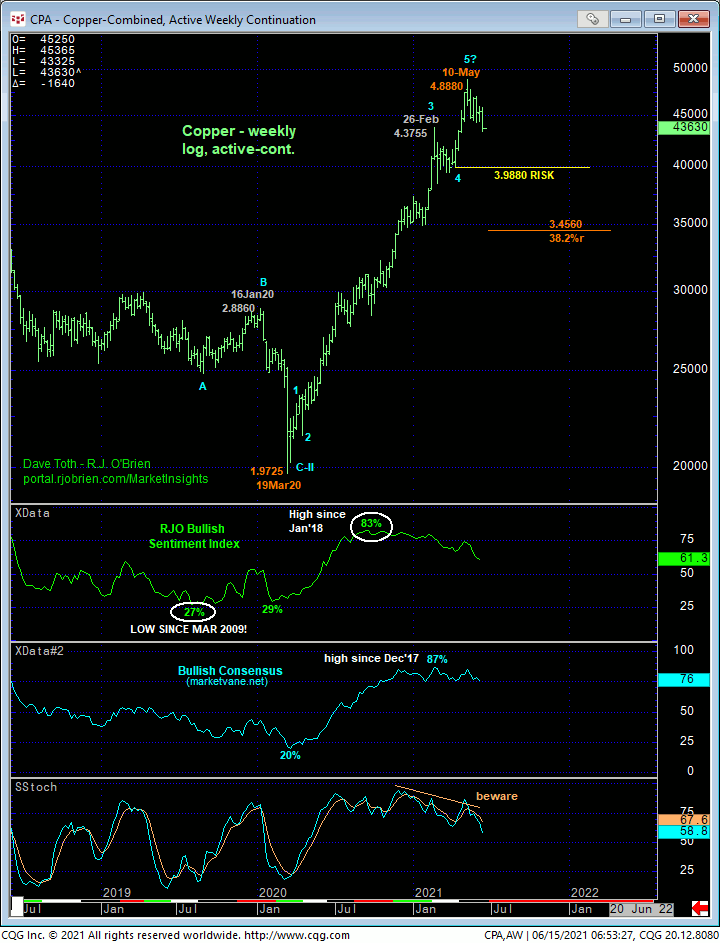
From a SCALE perspective, we fully acknowledged in 14-May’s Technical Blog that 13-May’s mo failure was of a grossly insufficient scale to conclude anything more than another corrective hiccup within the massive secular bull trend from Mar’20’s 1.9725 low. Indeed, even at this point, the past month’s setback still falls well within the bounds of a major BULL market correction, with commensurately larger-degree weakness below 12-Apr’s 3.9880 corrective low and key long-term risk parameter still required to, in fact, break the secular bull trend. But we also acknowledged ancillary threats to the secular bull in the forms of historically frothy bullish sentiment/contrary opinion, waning upside momentum since last Dec and an arguably complete and massive 5-wave Elliott sequence from last year’s low as labeled below.
Since 13-May’s micro mo failure, it has confirmed a bearish divergence in DAILY momentum that takes the peak/reversal threat to that next higher degree, leaving only 12-Apr’s 3.9880 as the coup de gras for even the longest-term commercial bulls. Might this setback still be “just” a correction? Sure, absolutely. But we have Fri’s 4.5950 corrective high as a specific and objective risk parameter from which to base and manage non-bullish decisions like long-covers and cautious bearish exposure. And traders are advised to do exactly that; maintain a bearish policy and exposure ahead of further and possibly protracted losses straight away with a recovery above 4.5950 required to negate this call and warrant its cover.
We are NOT inferring or implying for a moment that we believe the S&P market might be subject to the kind of weakness and vulnerability the copper market is now suffering. We are only using copper as an excellent example of smaller-degree corrective lows and risk parameters that, if violated, must be acknowledged as steps towards larger-degree failures and vulnerability that can threaten and eventually break the secular bull trend. Traders of all scales are urged to consider this copper example when addressing the management of S&P bull risk around corrective lows and risk parameters like 4207, 4165 and certainly 4029.
