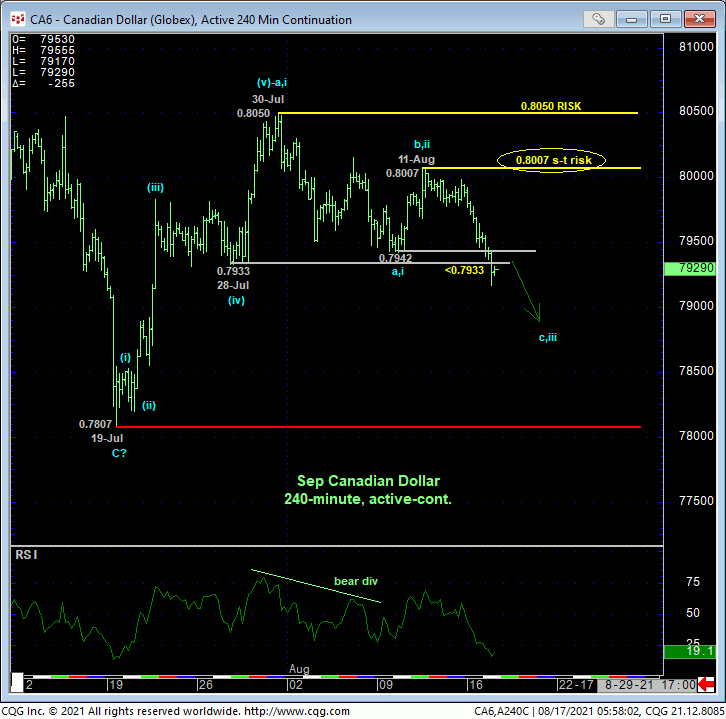
After exposing some upside potential with late-Jul’s rebound discussed in 29-Jul’s Technical Blog, the market’s gross failure to sustain that second-half-of-Jul uptrend has become fully apparent with today’s break below both 10-Aug’s 0.7942 initial counter-trend low and 28-Jul’s 0.7933 corrective low that confirms a bearish divergence in daily momentum. The important by-products of this week’s slide are the market’s definition of smaller- and larger-degree corrective highs at 0.8007 and 0.8050 that the market is now required to recoup to render the relapse attempt from 30-Jul’s 0.8050 high a 3-wave and thus corrective affair within a broader base/reversal environment. Until and unless such strength is shown, and for longer-term reasons we’ll discuss below, a resumption of a major peak/reversal count from 01-Jun’s 0.8328 high may lie ahead. Per such, 0.8007 and 0.8050 serve as our new short- and long-term risk parameters from which a bearish policy and exposure can be objectively rebased and managed by short- and longer-term traders, respectively.
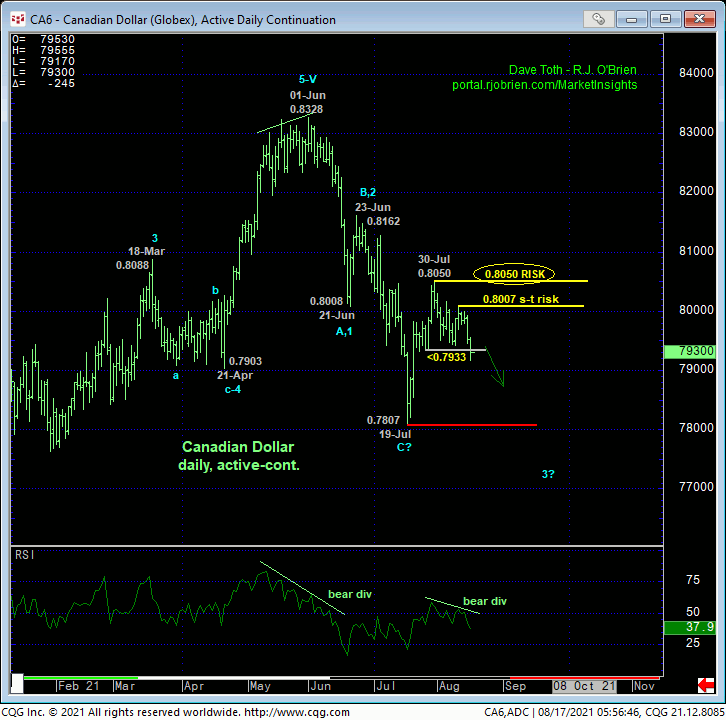
The daily bar chart above and close-only chart below show the magnitude of Jun-Jul’s relapse, the break of 21-Apr’s 0.7903 low of which confirmed a bearish divergence in WEEKLY momentum that broke Mar’20 – Jun’21’s major uptrend. In late-Jul, coming off a bullish divergence in daily momentum, we discussed the bullish possibility that, on a close-only basis, Jun-Jul’s decline might be a complete 3-wave correction as labeled below. If correct, this count would call for a resumption of the secular bull trend. After the past couple of weeks’ relapse however, this market has now got to recoup the recent corrective highs and risk parameters identified above to resurrect this bullish count. Until such strength is proven, Jul’s 0.7807 – 0.8050 recovery attempt cannot be overlooked as a 3-wave and thus corrective structure that now re-exposes this summer’s downtrend to eventual and potentially major losses below 0.7807.
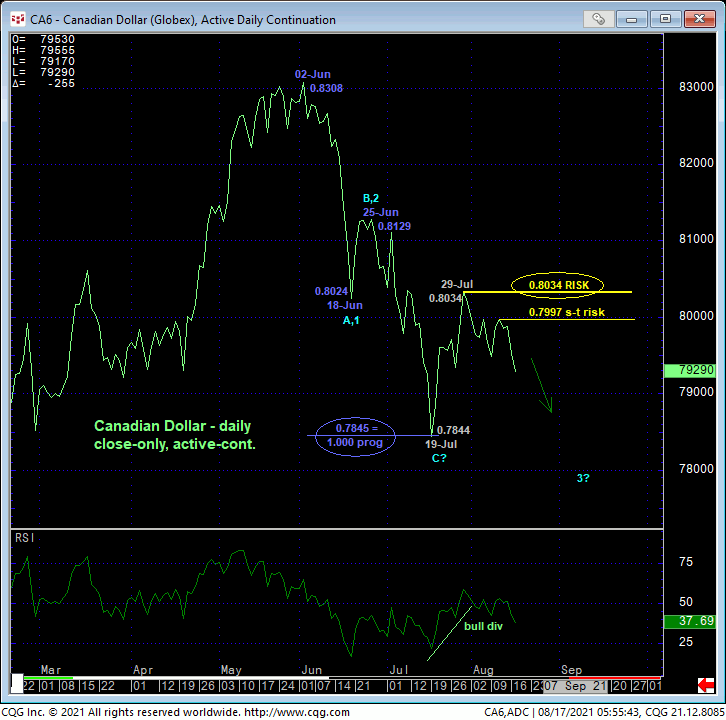
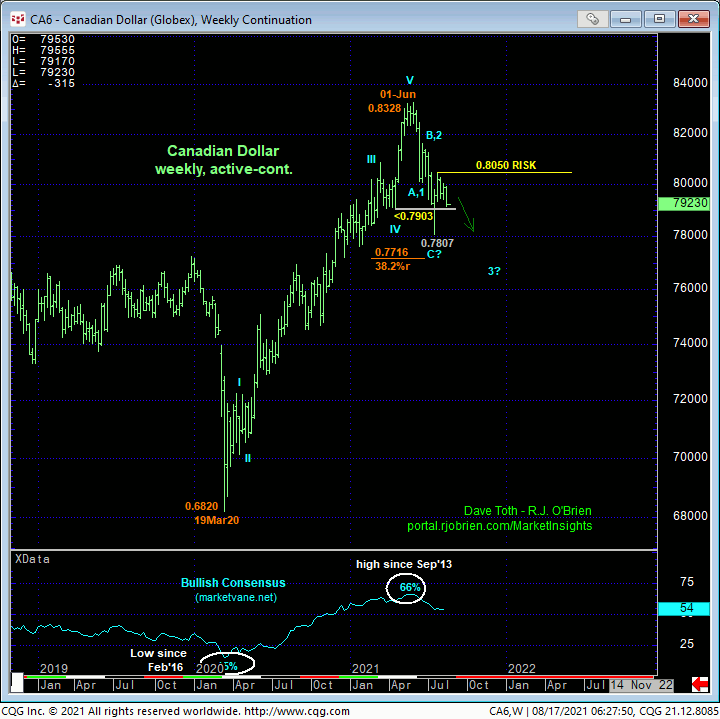
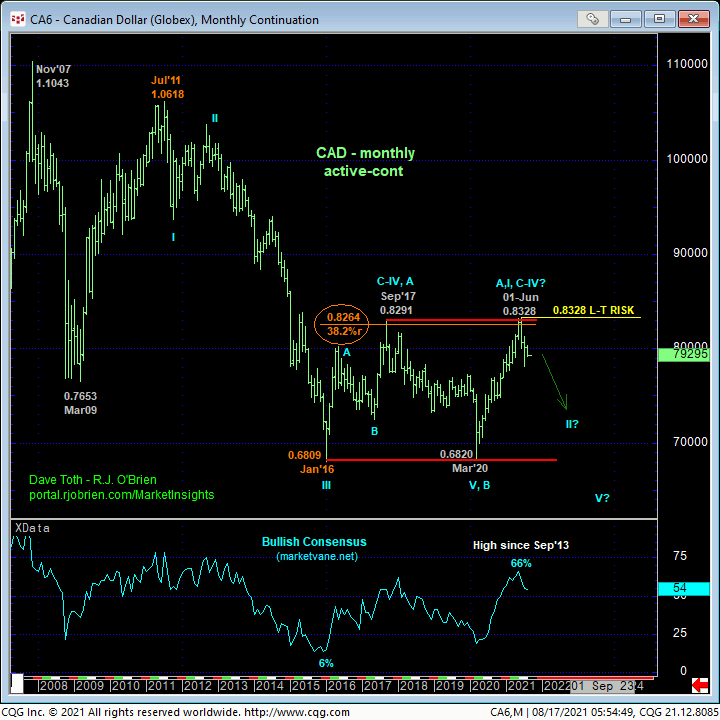
From an even longer-term perspective shown in the weekly (above) and monthly (below) charts, the combination of Jul’s break of 2020 – 2021’s 15-month uptrend below 0.7903 and the market’s rejection of the extreme upper recesses of the past 5-1/2-YEAR lateral range is a dangerous, compelling one that warns of at least a return to the middle-half bowels of this range and possibly to its lower recesses or even a resumption of secular bear market from 2011’s 1.0618 high. After all, the entre recovery attempt from Jan’16’s 0.6809 low has only retraced a Fibonacci minimum 38.2% of 2011 – 2016’s collapse from 1.0618 to 0.6809. On this basis and along with what is clearly only a 3-wave recovery attempt from 0.6809 thus far, it’s not hard to envision the entire 5-1/2-YEAR recovery from 0.6809 to 0.8328 as a corrective/consolidative structure ahead of a resumption of the secular bear market between 2011 and 2016 that preceded it to eventual new lows below 0.6809.
IF such a bearish count is what the market has in store, then it is imperative for the market to BEHAVE LIKE A BEAR by sustaining trendy, impulsive price action lower. Recoveries above levels like 0.8007 and especially 0.8050 would at least defer, if not mitigate such a bearish count and expose a steeper corrective rebuttal to Jun-Jul’s decline OR a resumption of the past year’s major bull. Until such strength is shown however, and especially if this market starts to exhibit trendy, impulsive losses in the period immediately ahead, traders should not be surprised by downside fallout that could be severe, even relentless.
These issues considered, a bearish policy remains advised longer-term institutional players with a recovery above 0.8050 require to negate this call and warrant its cover. Shorter-term traders have been advised to neutralize bullish policy and exposure as a result of today’s failure below 0.7933 and are further advised to resume a bearish policy and exposure from the 0.7950-area OB with a recovery above 0.8007 required to negate this specific count and warrant its cover. In lieu of a recovery above at least 0.8007, further and possibly accelerated losses are anticipated to eventual new lows below 0.7807 that then could open the downside floodgates for the long term.