
Posted on Sep 13, 2022, 07:20 by Dave Toth
NOV CANOLA
While the hourly chart of day-session prices below does not yet reflect it, overnight trading shows the market trading above 07-Sep’s 809.5 smaller-degree corrective high and our short-term risk parameter discussed in last Thur’s Technical Blog. This admittedly short-term strength is insufficient to conclude last week’s 766.0 low as the END of Apr-Sep’s whopping 32% decline. But given a developing and compelling list of larger-degree base/reversal-threat factors, this is exactly what we believe could lie ahead, with commensurately larger-degree strength above 26-Aug’s 857.0 larger-degree corrective high required to confirm such. Nonetheless, last week’s 766.0 low IS of a sufficient scale to conclude this low as a short-term risk parameter from which non-bearish decisions like short-covers and bullish punts can be objectively based and managed.
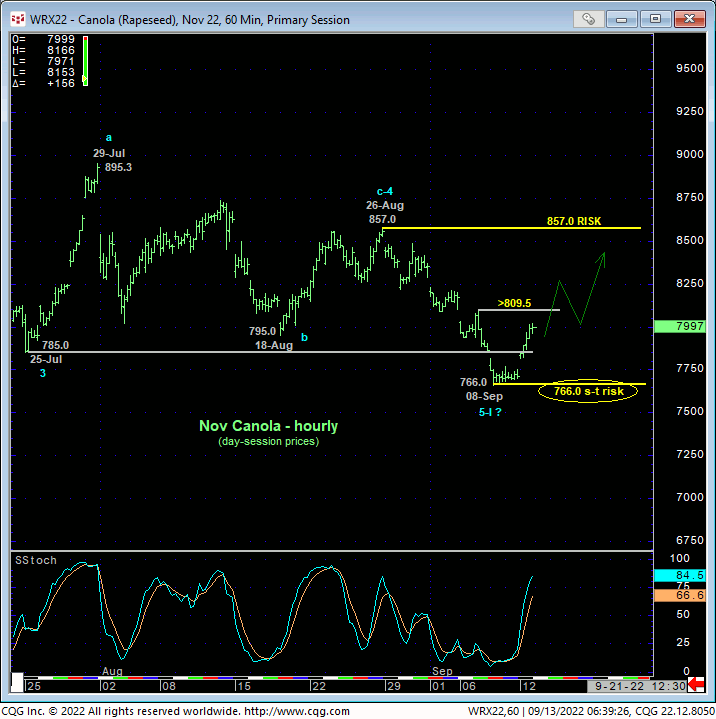
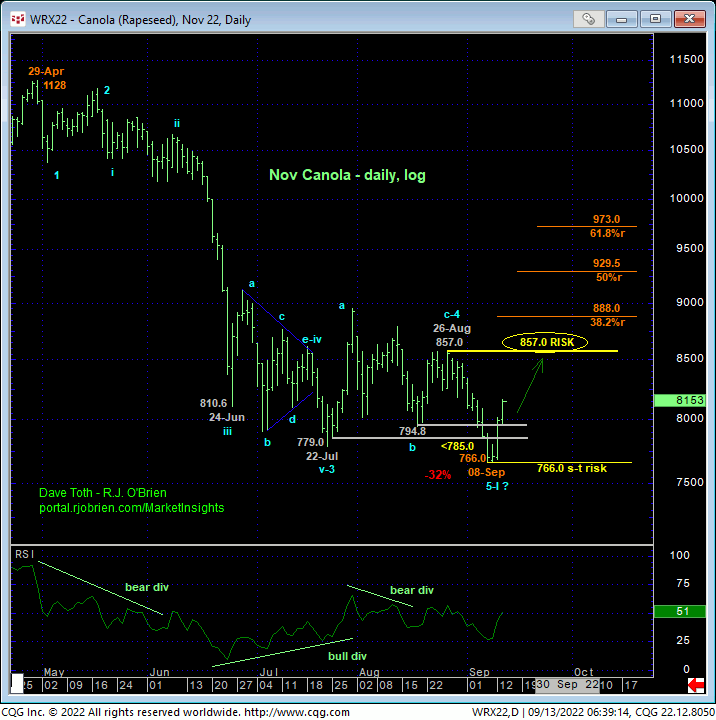
In Thur’s Technical Blog following that day’s break below the prior TWO MONTHS’ support ranging from 794-to-779, we discussed the resumption of the major bear trend ahead of possibly accelerated losses. This continued bear trend and count required the market to SUSTAIN losses below at least this 794-to-779-area of former support-turned-resistance and especially 26-Aug’s 857.0 larger-degree corrective high and key longer-term bear risk parameter. This latter requirement remains intact. But the market’s failure thus far to sustain losses below 794-to-779-area is an early threat to a more immediate bearish count.
In addition:
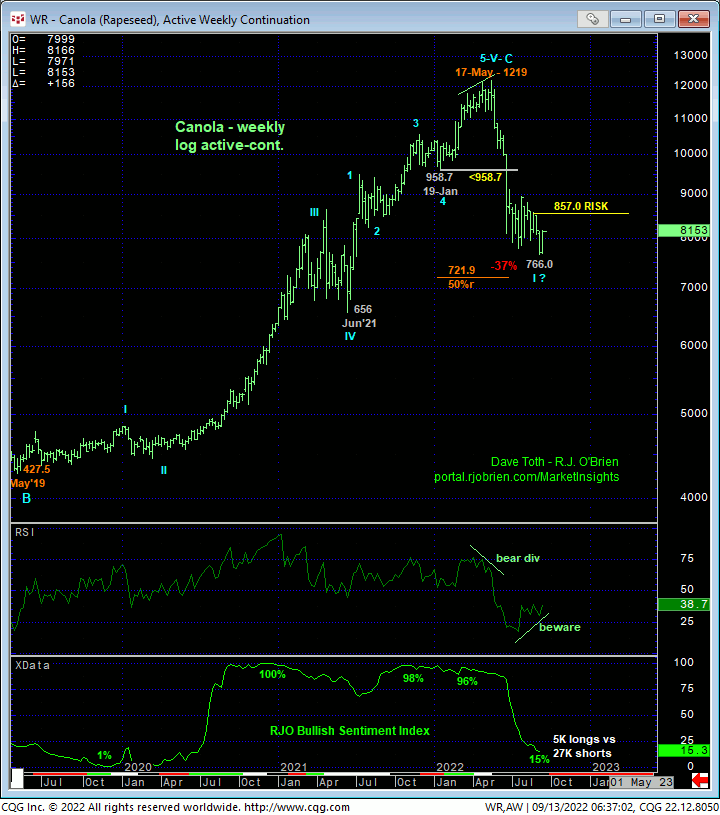
- the developing potential for a bullish divergence in WEEKLY momentum amidst
- historically bearish levels in our RJO Bullish Sentiment Index and
- the prospect that late-Aug/early-Jul’s 857 – 766 decline was the completing 5th-Wave to Apr-Sep’s entire decline
provide a compelling backdrop for a base/correction/recovery threat that warns of a correction of the entire 4-1/2-month, 362-CAD, 32% decline that could span weeks or even months and reach levels in the 888-to-973-range or higher.
To confirm this base/recovery count, the market is still required to recoup 26-Aug’s 857.0 larger-degree corrective high and key longer-term bear risk parameter. Until and unless the market negates this bullish prospect however with a relapse below 766.0, traders are advised to manage their risk according to their personal risk profiles. We believe this means a move to a neutral-to-cautiously-bullish policy and exposure for shorter-term traders with a failure below 766.0 required to negate this call, reinstate the bear and expose potentially steep losses thereafter. For longer0term commercial players, we believe bearish exposure should be pared to more conservative levels and neutralized-and-reversed into a bullish policy on a recovery above 857.0. In effect, we believe this market has identified 857 and 766 as the key directional triggers heading forward.
DEC SOYBEAN OIL
Given this developing bullish story in canola, it’s interesting to point out the extent and impulsiveness of the past couple days’ rebound in Dec bean oil detailed in the hourly chart below. While the market as yet to recoup 12-Aug’s 68.16 high and our short-term bear risk parameter, this current recovery is sufficient to render the sell-off attempt from that 68.16 high to Thur’s 61.32 low a 3-wave affair as labeled below. Left unaltered by a relapse below 61.32, this 3-wave decline is considered a corrective/consolidative affair that warns of a resumption of Jul-Aug’s uptrend that preceded it. Per such, 61.32 is considered our new key risk parameter from which non-bearish decisions like short-covers and bullish exposure can be objectively rebased and managed.
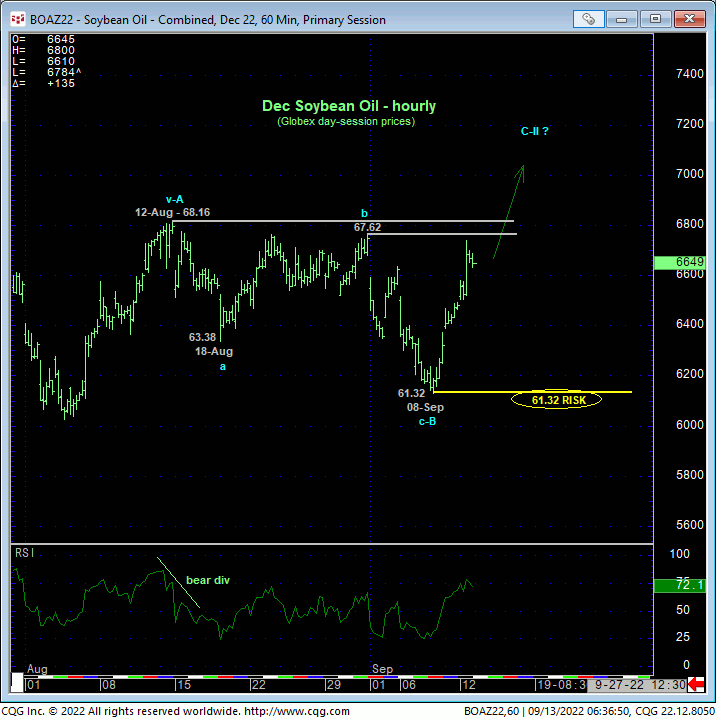
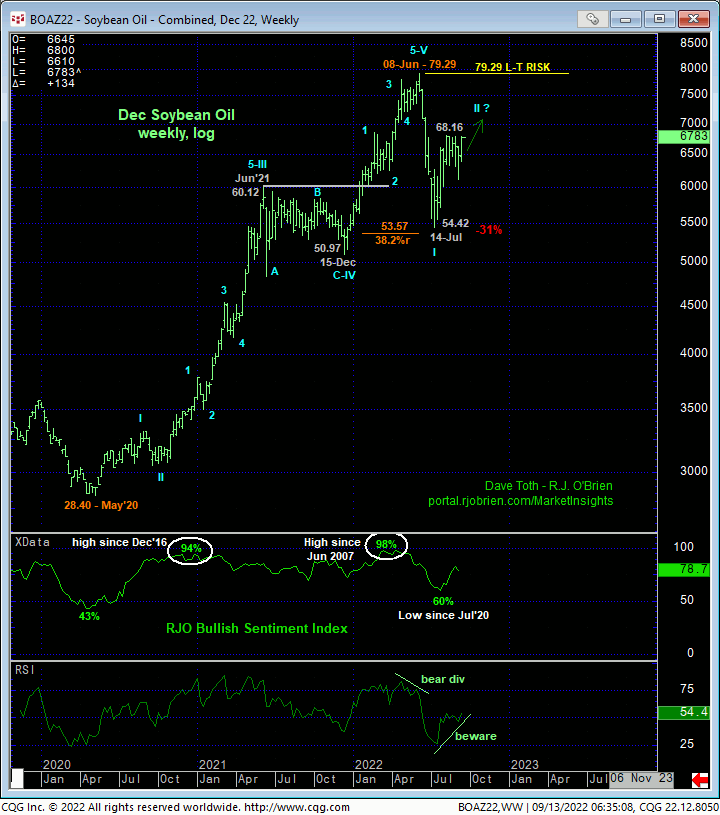
The Fibonacci fact that last week’s 61.32 Globex day-session low and 61.24 overnight low straddle the (61.29) 50% retrace of Jul-Aug’s 54.42 – 68.16 rally would seem to reinforce Aug-Sep’s setback as a 3-wave corrective structure, warning of a resumption of Jul-Aug’s uptrend to new highs above 68.16. It’s also notable that, on a longer-term weekly basis below, a break above 68.16 will confirm a bullish divergence in WEEKLY momentum. And with NO levels of any technical pertinence above 68.16 shy of 08-Jun’s 79.29 high, the market’s upside potential will be considered indeterminable above 68.16 and potentially extreme.
This said, the extent and impulsiveness of Jun-Jul’s 31% plunge maintains a long-term PEAK/reversal-threat process until and unless negated by a recovery above Jun’s 79.29 high. This means that even above 12-Aug’s 68.16 high, the major recovery from 14-Jul’s 54.42 low remains within the bounds of a 2nd-wave CORRECTION within a massive peak/reversal environment. If/when the market takes out that 68.16 high, it would be incumbent on the bull to sustain trendy, impulsive behavior higher in order to threaten our long-term peak/reversal count in favor of an alternate bullish count that would mean a resumption of the secular bull trend to new highs above 79.29. If a countering bearish divergence in momentum is confirmed from 68.16+ levels, perhaps around the (69.79) 61.8% retrace of Jun-Jul’s 79.29 – 54.42 decline, then risk/reward merits will flip back to the bear side.
These issues considered, traders are advised to prepare for a break above 12-Aug’s 68.16 ahead of indeterminable gains thereafter. A failure below 61.32 is required at this point to negate this call and reinstate what we maintain is a major, multi-month peak/reversal process. Above 68.16, we will keep a keen eye on MOMENTUM where a countering bearish divergence in momentum from a level shy of Jun’s 79.29 will flip the script back to the bear side.

