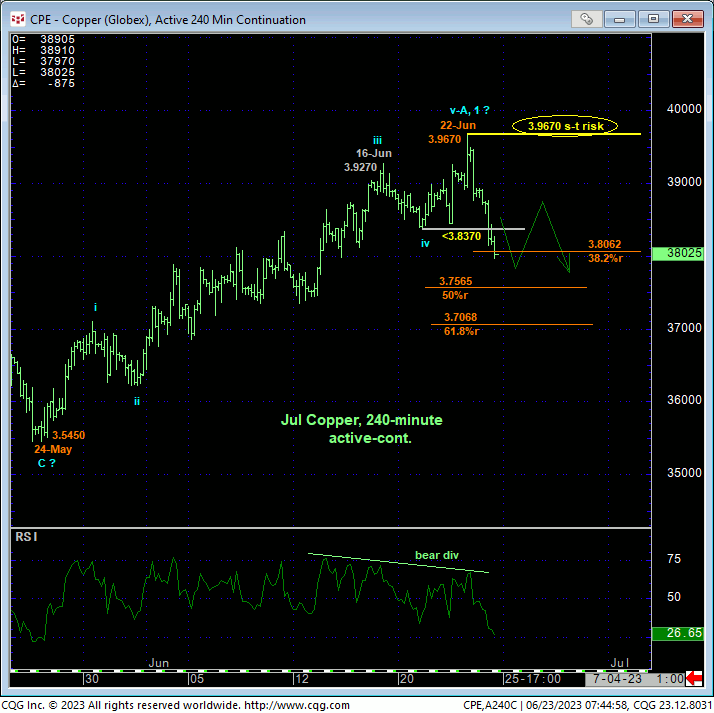
The market’s failure overnight below Tue’s 3.8370 minor corrective low and short-term risk parameter discussed in yesterday’s Technical Webcast confirms a bearish divergence in short-term momentum. This mo failure defines yesterday’s 3.9670 high as the END of what appears to be a textbook 5-wave Elliott sequence up from 24-May’s 3.5450 low and thus our new short-term parameter from which the risk of non-bullish decisions like long-covers and cautious bearish punts can now be objectively based and managed.
The prospect that the past month’s rally is a 5-wave sequence poses a theoretical dilemma for any longer-term bearish count we’ll discuss below because corrections (within a broader bear trend) are not 5-wave sequences, they’re 3-wave structures. Again, “theoretically”, this suggests that the past month’s recovery is either only an (A-Wave) part of a correction that’s got more to go OR the 1st-Wave of a much broader bullish count.
Understanding over time that Elliott theory and practice can vary greatly, traders need to consider two upcoming requirements for a broader bullish count to be reinforced:
- if there’s something broader to the bull side in store, any relapse attempts must be 3-wave corrective events with a countering bullish divergence in short-term mo needed to arrest the short-term downtrend, and
- most pointedly, the bull needs to recoup yesterday’s 3.9670 high.
Until/unless these two requirements are met, traders are urged not to underestimate the extent to which this market might correct OR REVERSE lower.


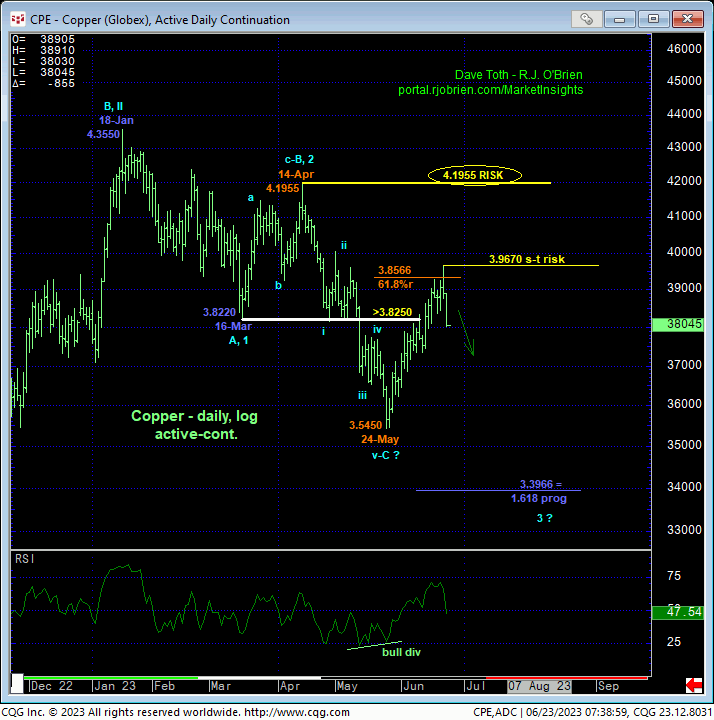
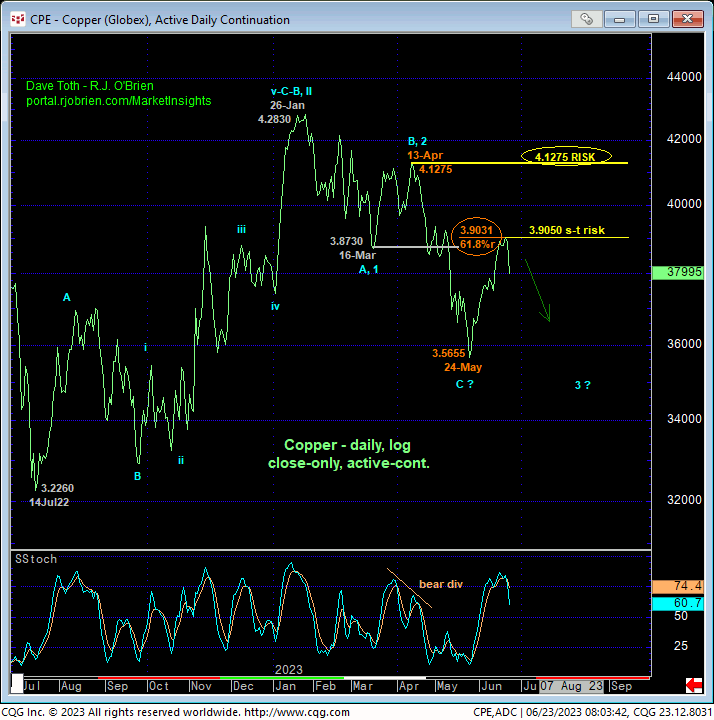
The reason we’re concerned with potentially much greater downside potential is that from a longer-term perspective, the daily log scale high-low chart above and daily log close-only chart below show this YEAR’S longer-term trend as still arguably DOWN. Moreover, the past month’s recovery attempt has thus far stalled around the immediate neighborhood of the 61.8% retrace of Apr-May’s portion of this year’s downtrend. On a closing basis below, Wed’s 3.9050 high was only 19 ticks away from the (3.9031) 61.8% retrace of Apr-May’s 4.1275 – 3.5655 decline. Combined with former 3.87-handle-area support from mid-Mar as a new resistance area, it’s not hard to see the importance of this week’s highs and resistance as a short-term but key area around which to base non-bullish decisions.
Yes, thus far this year’s entire sell-off attempt has only unfolded into a 3-wave structure that could be just a correction ahead of a resumption of Jul’22 – Jan’23’s uptrend that preceded it. But if this is the case, we have those two requirements listed above to reinforce such a count. If it’s not, and if the past month’s recovery is a correction within this year’s broader and still-developing bear trend, we could see protracted losses in the months and even quarters ahead.

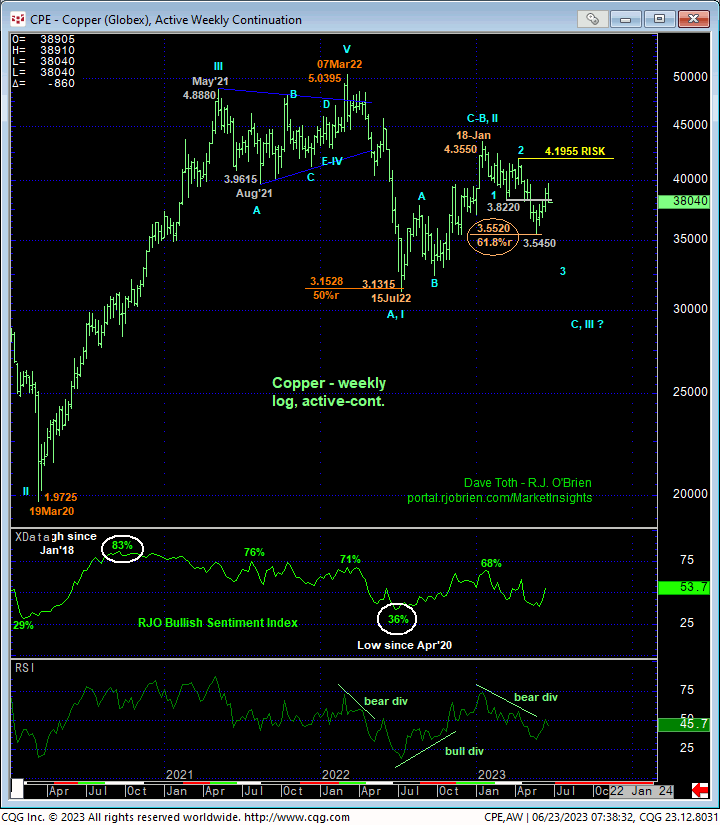
Lastly and on an even broader scale, the weekly log active-continuation chart below shows the magnitude of 2022’s reversal as well as Jul’22 – Jan’23’s 3-wave and thus corrective structure that remain consistent with a massive, multi-quarter PEAK/reversal-threat process that, if correct, warns of an eventual resumption of last year’s downtrend to eventual new lows below 3.13. Against this long-term backdrop, there is much riding on the MANNER in which this market trades lower in the period immediately ahead. For IF a broader bearish count is what the market has in store, then we would expect to see sustained, trendy, impulsive price action to the downside and NOT labored 3-wave corrective behavior from this week’s high.
These issues considered, shorter-term traders have been advised to neutralize bullish exposure and are further advised to consider cautious bearish exposure with a recovery above 3.9670 required to negate this specific count and warrant its cover. Longer-term commercial players remain advised to maintain a bearish policy and exposure with a recovery above 3.9670 required to pare exposure to more conservative levels and commensurately larger-degree strength above 4.1275 required to negate this call altogether and warrant neutralizing remaining exposure. In lieu of a recovery above 3.9670, further and possibly protracted losses should not surprise.


