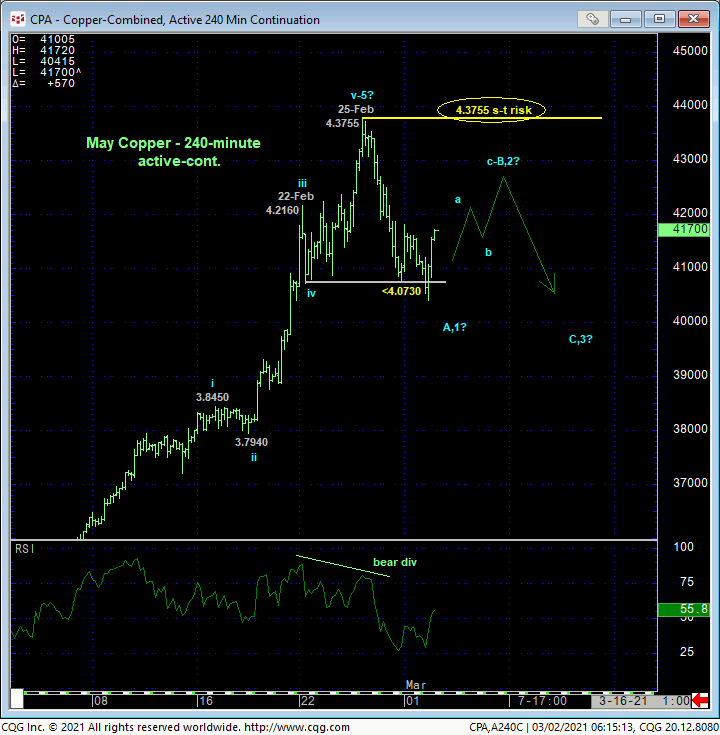
Overnight’s failure below 22-Feb’s 4.0730 smaller-degree corrective low and our short-term risk parameter discussed in 23-Feb’s Technical Webcast confirms a bearish divergence in short-term momentum. The 240-min chart below shows that this mo failure defines 25-Feb’s 4.3755 high as one of developing importance and our new short-term risk parameter from which non-bullish decisions like long-covers and cautious bearish punts can be objectively based and managed by both short- and longer-term traders.
As we’ll discuss below, this momentum failure is of a grossly insufficient scale to conclude anything more than another interim correction within the secular bull trend at this point. Given the market’s proximity to the extreme upper recesses of its historical range and amidst historically frothy bullish sentiment levels however, even longer-term commercial players are advised to move to a more conservative approach to risk assumption and pare bullish exposure to more conservative levels with a recovery above 4.3755 required to mitigate a peak/correction/reversal threat that could be major in scope.
IF the past few days’ break IS the initial (A- or 1st-Wave) of a larger-degree correction or reversal lower, then reinforcing proof would be required in the form of labored, corrective, 3-wave behavior on an expected recovery attempt that falls shy of last week’s 4.3755 high. A recovery-stemming bearish divergence in short-term momentum is needed to cap such a rebound and identify a more reliable high and resistance from which bearish punts can then be objectively based and managed. And if such requirements are satisfied, the risk/reward merits of a bearish play could be outstanding.


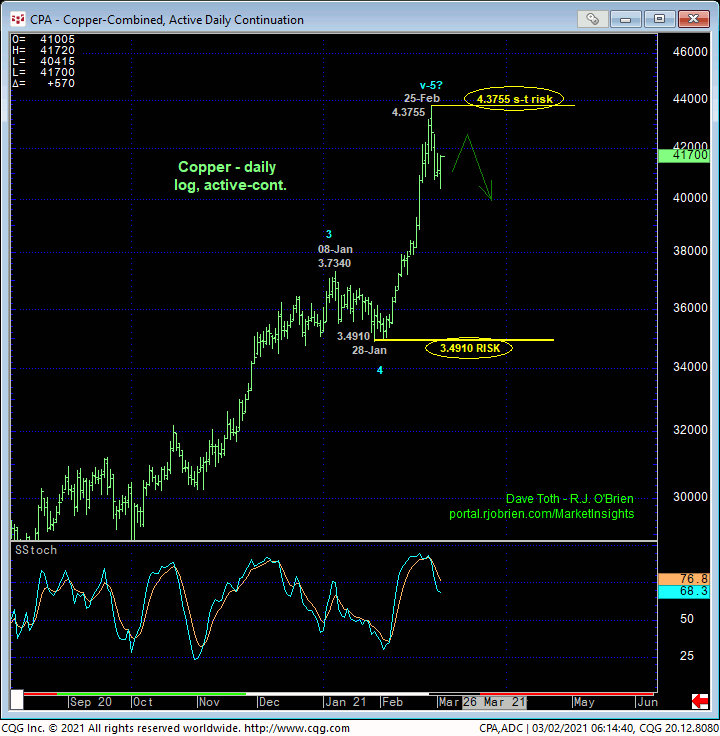
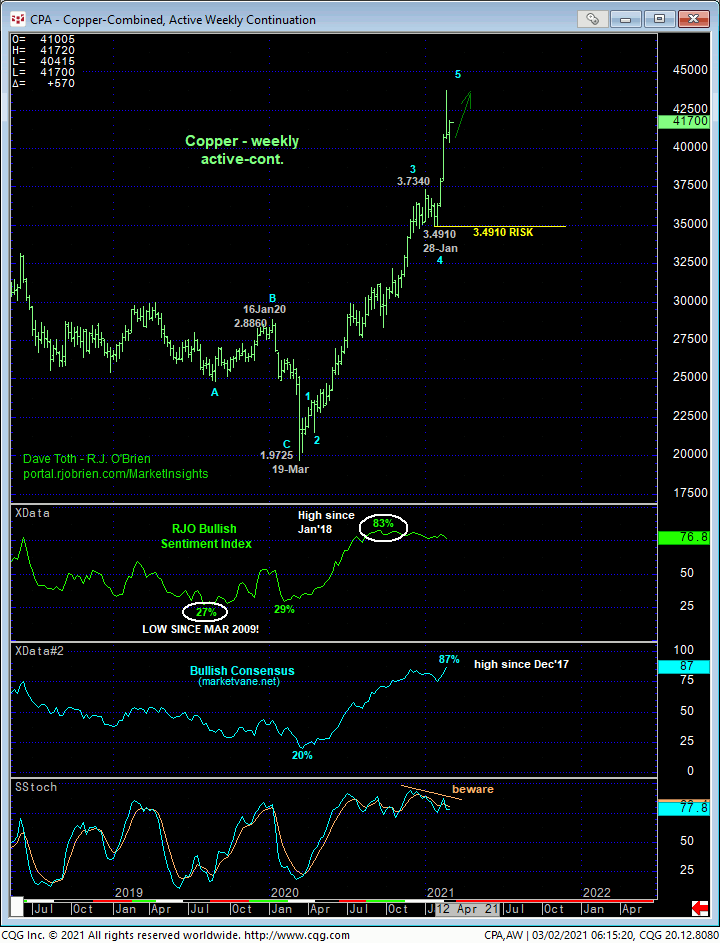
Stepping back to consider longer-term views in the daily log chart above and weekly chart below, it is absolutely clear that the past few days’ setback is of too small a scale to conclude anything more than another iterative corrective stair-step within the secular bull trend. The technical and trading challenge however comes in when acknowledging and accepting the commensurately larger-degree weakness required to break the secular bull trend. For what’s also clear in these two charts is the fact that a break of 28-Jan’s 3.4910 larger-degree corrective low is required to break the secular bull trend that dates from 19Mar20’s 1.9725 low. This is a direct result of the extent and uninterrupted manner of Feb’s steep continuation of the bull. With the exception of overnight’s 4.0415 low, there are NO levels of any technical merit below the market shy of former 3.70-area resistance from Jan.
Might the Jan-Feb portion of the rally be the completing 5th-Wave of the rally from last year’s 1.9725 low? Yes. But the past few days’ slippage is woefully insufficient to conclude such.
Might the historically frothy bullish sentiment levels contribute to a major peak/reversal-threat environment? Absolutely. But the past few days’ slippage is not of a sufficient scale to truly render sentiment/contrary opinion an applicable technical tool.
Against this backdrop then, longer-term commercial players have to consider the practicality of a “commensurately larger-degree risk parameter” at 3.4910. While such a larger-degree risk parameter is certainly “objective”, it’s our opinion that it’s too impractical to consider. Per such, longer-term players are advised to pare or neutralize bullish exposure along with shorter-term traders and acknowledge and accept whipsaw risk (back above 4.3755) in exchange for much deeper nominal risk below 3.4910.

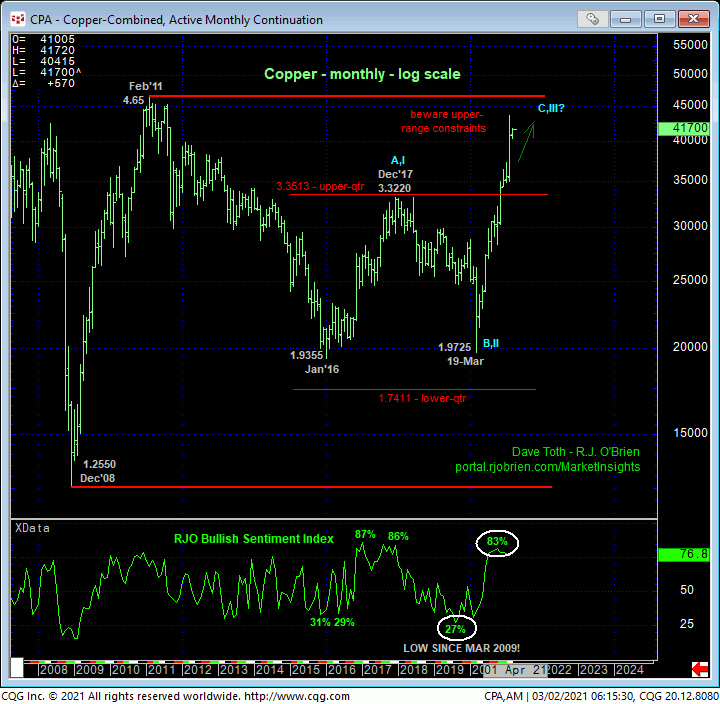
Finally, only a glance at the monthly log scale chart below is needed to see the market’s proximity to the extreme upper recesses of its historical range. Along with the factors listed above, it’s not hard to question the risk/reward merits of maintaining a bullish policy “up here”.
These issues considered, all traders are advised to move to a neutral/sideline position to circumvent the depths unknown of a correction or reversal lower. A recovery above 4.3755 will mitigate this peak/correction/reversal threat, reinstate the bull and expose potentially steep gains thereafter, warranting a return to a bullish policy. We will be watchful for proof of labored behavior on a recovery attempt that falls shy of 4.3755 for what could be a very favorable risk/reward opportunity from the bear side.


