Posted on Dec 28, 2023, 07:34 by Dave Toth
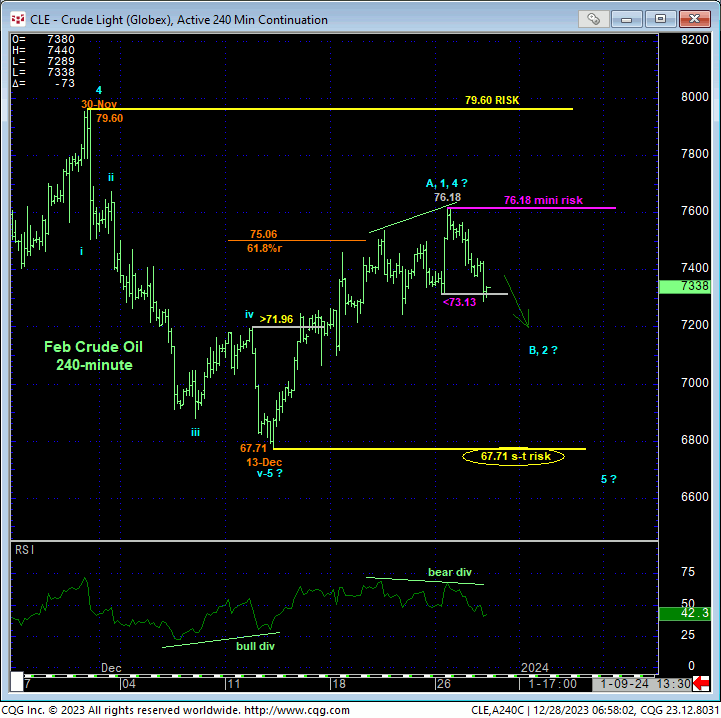
In yesterday’s Technical Webcast we discussed the importance of Tue’s 73.13 admittedly minor corrective low as a mini risk parameter this market needed to sustain gains above to maintain a more immediate bullish count within a developing base/correction/reversal count from 13-Dec’s 67.71 low. The 240-min chart below shows the market’s failure overnight below this level, confirming a bearish divergence in very short-term momentum that defines Tue’s 76.18 high as THE END of the uptrend from 13-Dec’s 67.71 low. In this very short-term regard then, that 76.18 high may be used as an objective parameter from which shorter-term traders can objectively base non-bullish decisions like long-covers and cautious bearish punts.
The challenge now becomes one of identifying what the recent 67.71-to-76.18 rally is. Is it the initial A- or 1st-Wave of a more protracted correction or reversal higher OR a (4th-Wave) correction ahead of a resumption of not only the major decline from 28-Sep’s 95.03 high, but possibly the resumption of 2022’s secular bear trend? HOW the market relapses in the period immediately ahead- either in a more labored, corrective manner OR a trendy, impulsive manner will provide the next clue. And of course, a break below 13-Dec’s 67.71 low will negate any base/correction/reversal threat and reinstate at least the 3-month downtrend. In this regard, that 67.71 low still serves as an objective BULL risk parameter.


In yesterday’s webcast, we discussed the technical elements on which a base/correction/reversal environment is predicated:
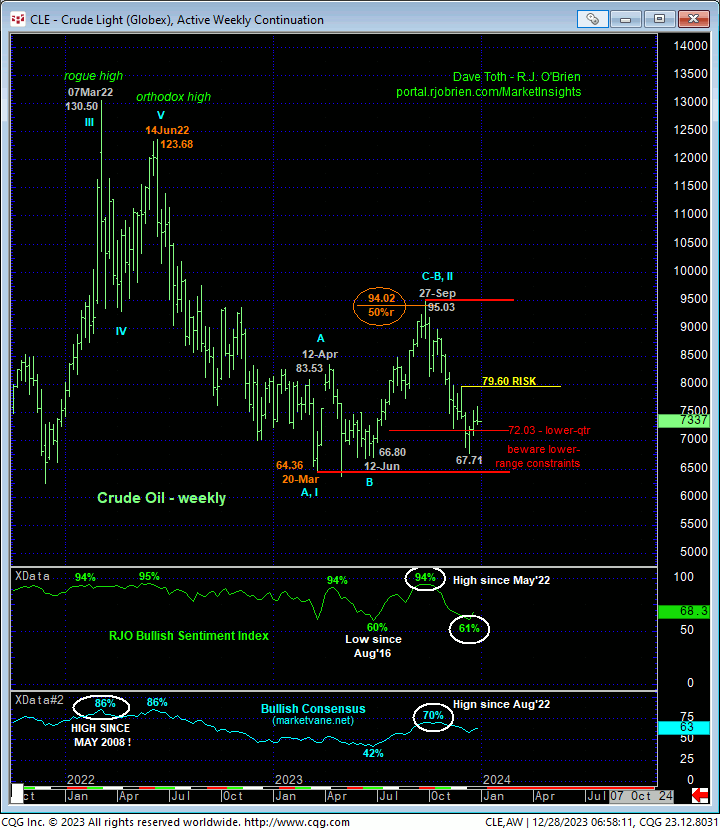
- the market’s recent proximity to the extreme lower recesses of this year’s range shown in the weekly chart below,
- the return to historically low levels in our RJO Bullish Sentiment Index of the hot Managed Money positions reportable to the CFTC, and
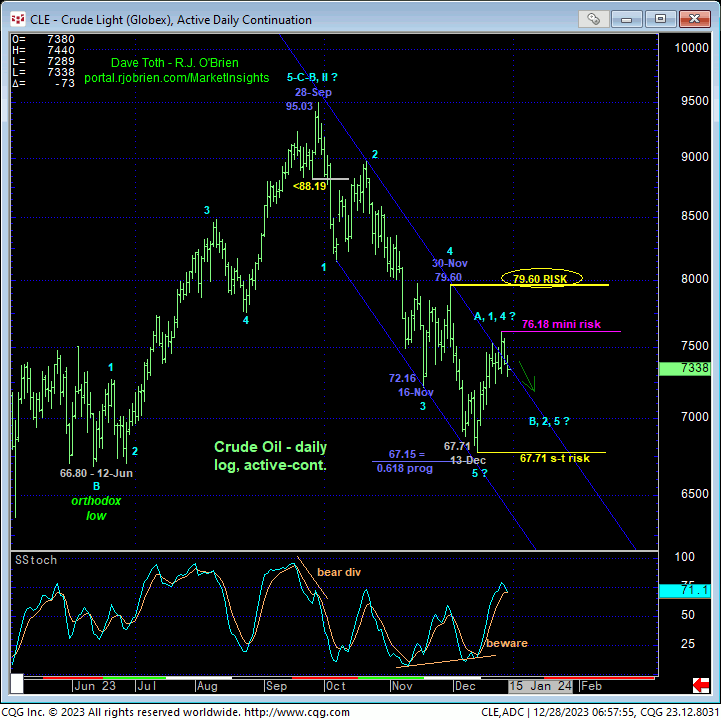
- the prospect that the decline from 28-Sep’s 95.03 high to 13-Dec’s 67.71 low is a textbook complete 5-wave Elliott sequence as labeled in the daily log chart above.
While the past couple weeks’ recovery is not unimpressive, since the market did not, in fact, break Sep-Dec’s downtrend by eclipsing 30-Nov’s 79.60 larger-degree corrective high, it would be premature to conclude at this juncture that this latest bounce isn’t another correction similar to those in Nov and Oct ahead of a resumption of the broader downtrend to new lows below 67.71. IF this is the case however, then the bear would be expected to BEHAVE LIKE ONE by sustaining trendy, impulsive behavior lower and ultimately breaking 13-Dec’s 67.71 low.
Alternatively, IF the past couple weeks’ pop is the initial A- or 1st-Wave of a more protracted correction or reversal higher, then we should expect a 3-wave, labored relapse in the period ahead, perhaps to the area around the (70.95) 61.8% retrace of the 67.71 – 76.18 rally. This process would, not surprisingly, be the exact opposite of that that describes the topping process that unfolded from 28-Sep’s 95.03 high that included an initial 1st-Wave decline to 06-Oct’s 81.50 low that was followed by a 61.8% retrace for Wave-2 up to 20-Oct’s 89.85 high before the 3rd-Wave bottom fell out.
These issues considered and on the heels of overnight’s bearish divergence in short-term momentum, we anticipate at least a (B- or 2nd-Wave) corrective rebuttal to the recent rally from 13-Dec’s 67.71 low that could easily retrace to the 71.95-to-70.95-area or lower in the period immediately ahead. To negate this call and resurrect a base/reversal count, the market now must recoup Tue’s 76.18 high that would warrant increased or resumed participation from the bull side. We will keep a keen eye on momentum around levels below 71.95 where a confirmed divergence will be required to arrest the relapse and present what could be a very favorable risk/reward buying opportunity indeed. Until/unless these price level and momentum conditions are met, and/or the market recoups 76.18, it would be premature to conclude the 3-month downtrend isn’t resuming to new lows below 67.71. For bull hopefuls looking to fade this relapse, that’s quite OK, but it acknowledges and accepts bull risk to a level just below 67.71.


