MAR RBOB
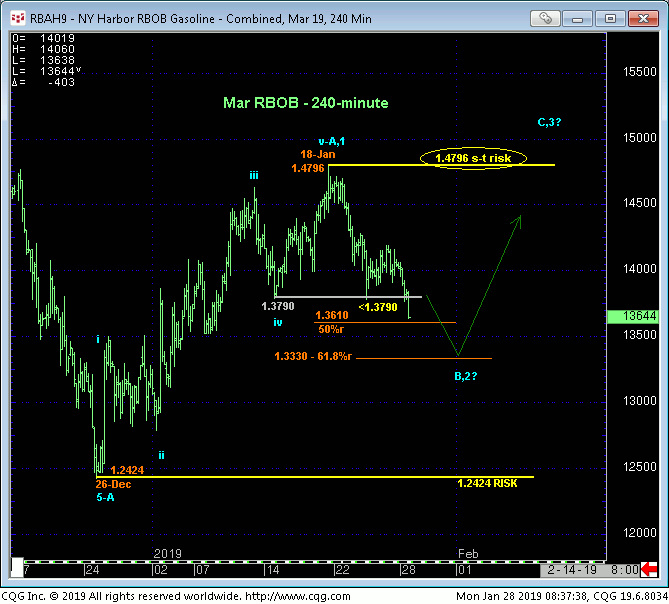
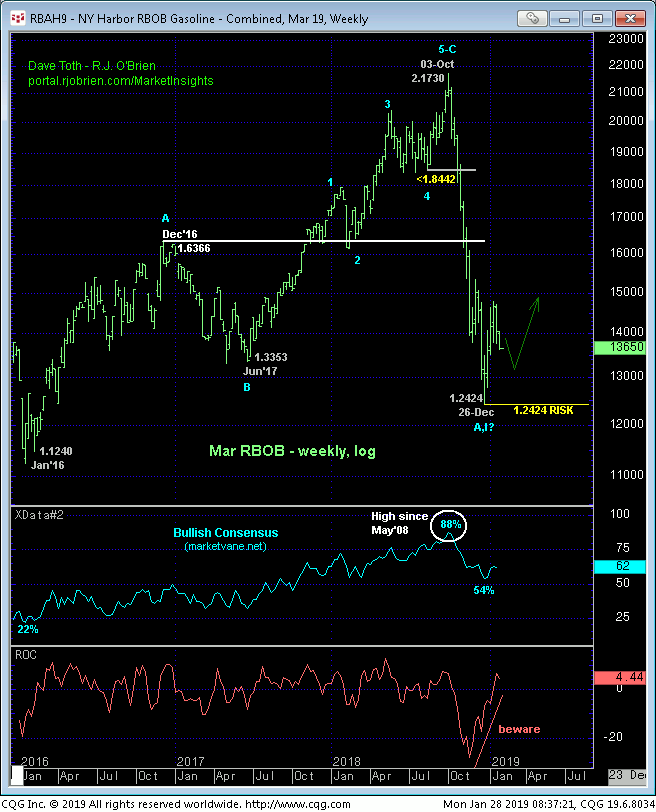
Today’s break below 14-Jan’s 1.3790 low and short-term risk parameter confirms a bearish divergence in momentum that defines 18-Jan’s 1.4796 high as the END of a nice 5-wave Elliott sequence up from 26-Dec’s 1.2424 low in the now-prompt Mar contract. Per such that 1.4796 high serves as our new short-term risk parameter from which non-bullish decisions like long-covers and cautious bearish punts can now be objectively based and managed.
The 240-min chart below also shows that this relapse has thus far retraced nearly 50% of Dec-Jan’s 1.2424 – 1.4796 rally that could easily have a lot more to go. We will be watchful in the week or so ahead for a relapsing stemming bullish divergence in short-term mo that would be consistent with our broader base/reversal-threat count that contends this relapse is just a (B- or 2nd-Wave) correction of early-Jan’s rally within a broader base/reversal PROCESS.
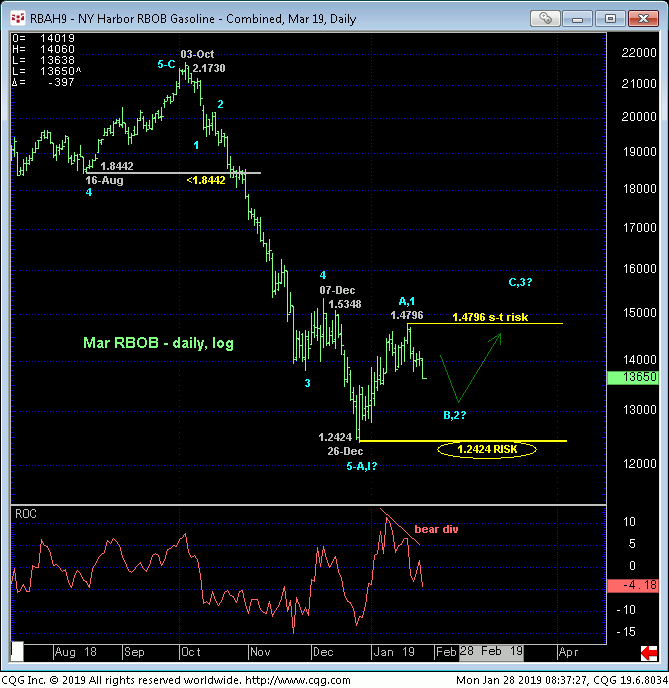
The daily chart above shows the bearish divergence in mo that stemmed Dec-Jan’s rally, but the extent and impulsiveness of this rally maintains the prospect that that rally is just the initial (A- or 1st-Wave) of a broader base/reversal from 26-Dec’s 1.2424 low and key risk parameter this market is required to relapse below to negate this count and reinstate 4Q18’s major downtrend. In effect the market has identified 1.2424 and 1.4796 as the key directional triggers heading forward. The market’s position in the middle of these key range boundaries presents poor risk/reward merits from which to initiate directional exposure, so a neutral/sideline policy is advised for most traders. Long-term players remain OK to maintain a bullish policy, but this acknowledges and accepts bull risk to the only legitimate risk parameter that exists, 26-Dec’s 1.2424 low.
MAR HEATING OIL
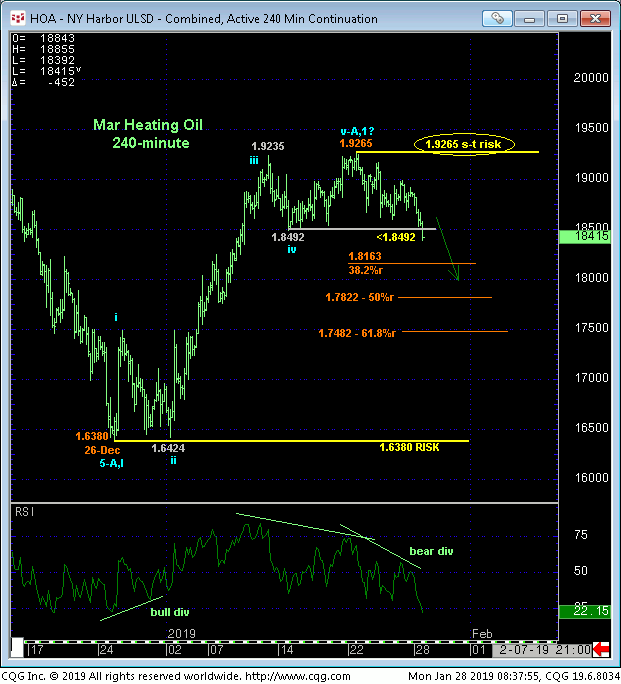
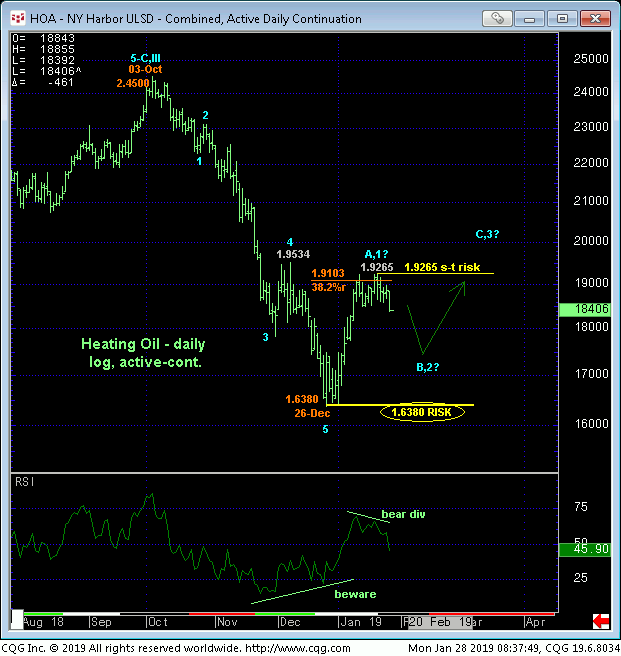
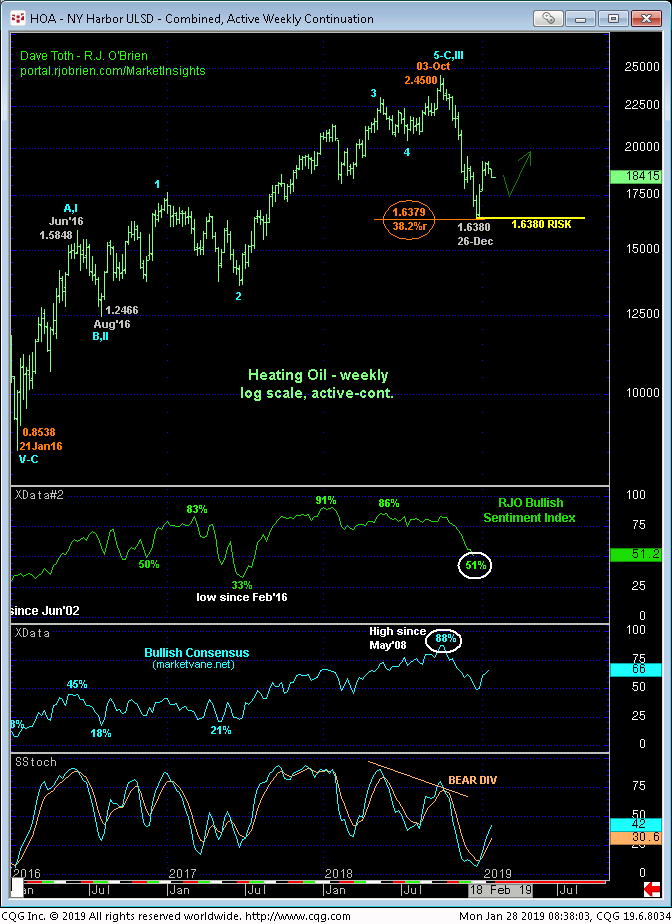
This morning’s failure below 14-Jan’s 1.8492 corrective low and our short-term risk parameter presents an identical technical construct and expectations for the heating oil market to those detailed above for gas, with 21-jan’s 1.9265 high and 26-Dec’s 1.6380 low considered our key short- and longer-term risk parameters from which to base and manage the risk of bearish and bullish decisions, respectively. We will be watchful for a relapse-stemming bullish divergence in mo in the week or two ahead for a favorable risk/reward opportunity from the bull side. In lieu of such a bullish divergence in mo, further and possibly relatively steep (i.e. <1.7500) losses should not surprise.
MAR CRUDE OIL
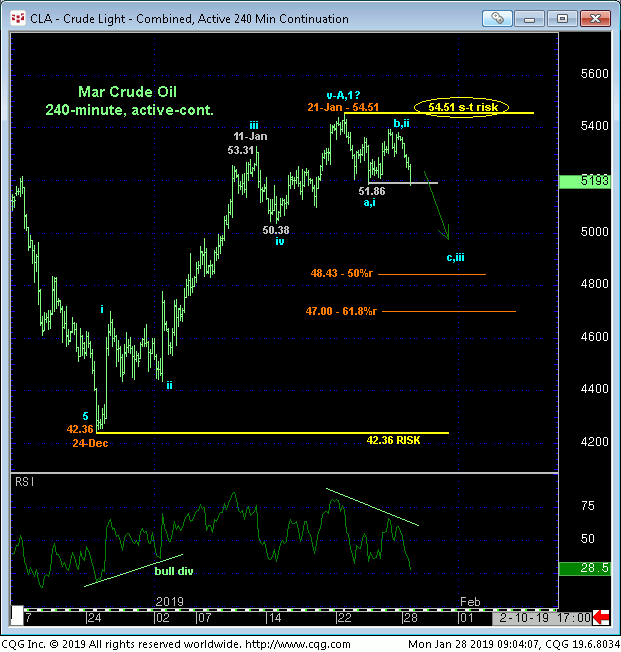
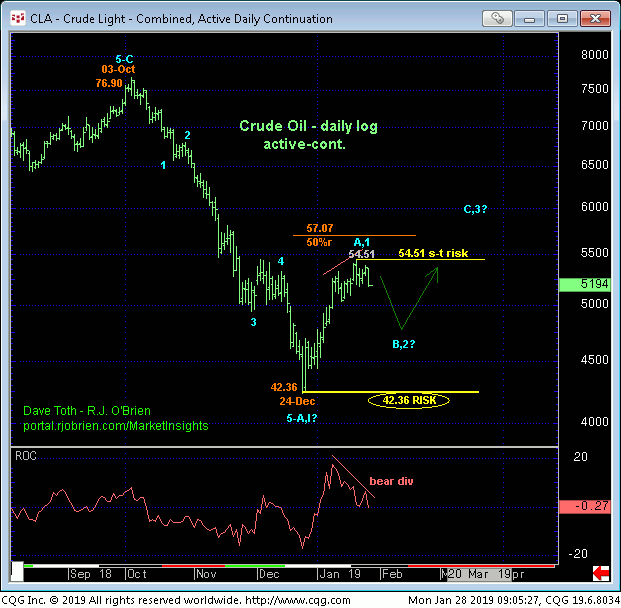
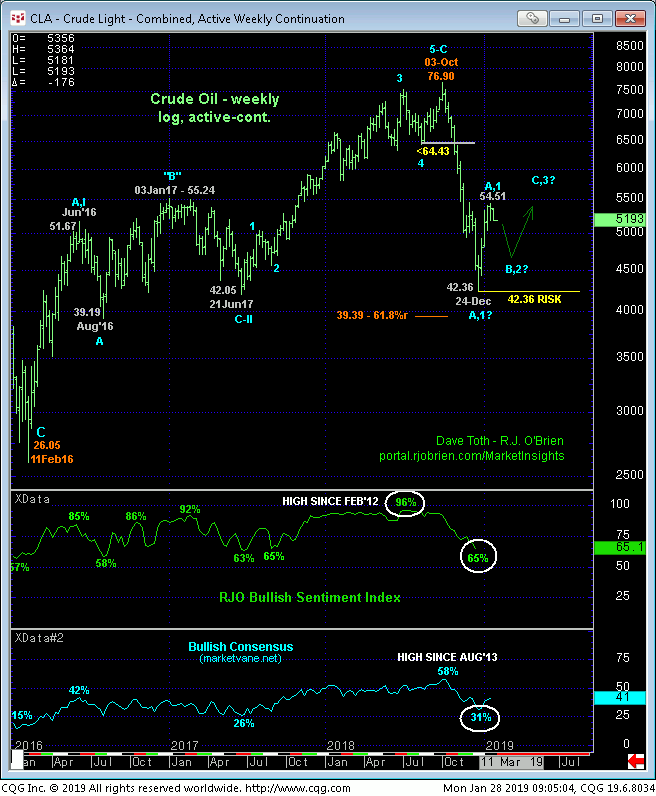
Not surprisingly, the crude oil market has followed suit with this morning’s momentum failure below 23-Jan’s 51.86 initial counter-trend low that leaves 21-Jan’s 54.51 high in its wake as the end of a textbook 5-wave Elliott sequence from 24-Dec’s 42.36 low. We anticipate a correction of this rally in the week or two ahead that may be relatively deep (i.e. <61.8% retrace around 47.00). We will be watchful for a relapse-stemming bullish divergence in mo to reject/define a low from which a resumed bullish policy and exposure can be objectively rebased and managed. In the meantime shorter-term traders have been advised to move to a neutral-to-cautiously-bearish stance with a recovery above 54.51 required to negate this count calling for a deeper correction. Long-term players are advised to pare or neutralize bullish exposure to more conservative levels to reduced the risk of a setback as 24-Dec’s 42.36 low remains intact as the only long-term risk parameter to a bullish play, and that’s rather impractical from current 52.00-area prices.
