OCT HEATING OIL
In yesterday’s Technical Webcast we identified Friday’s 2.2364 low as the latest smaller-degree corrective low the market needed to sustain gains above to avoid confirming a bearish divergence in momentum. The market’s failure to do so defines yesterday’s 2.3093 high as the END of a textbook 5-wave Elliott sequence up from 15-Aug’s 2.0760 low and exposes at least an intermediate-term correction of this rally. As a result, yesterday’s 2.3093 high serves as our new short-term risk parameter from which non-bullish decisions like long-covers and cautious bearish punts can now be objectively based and managed.
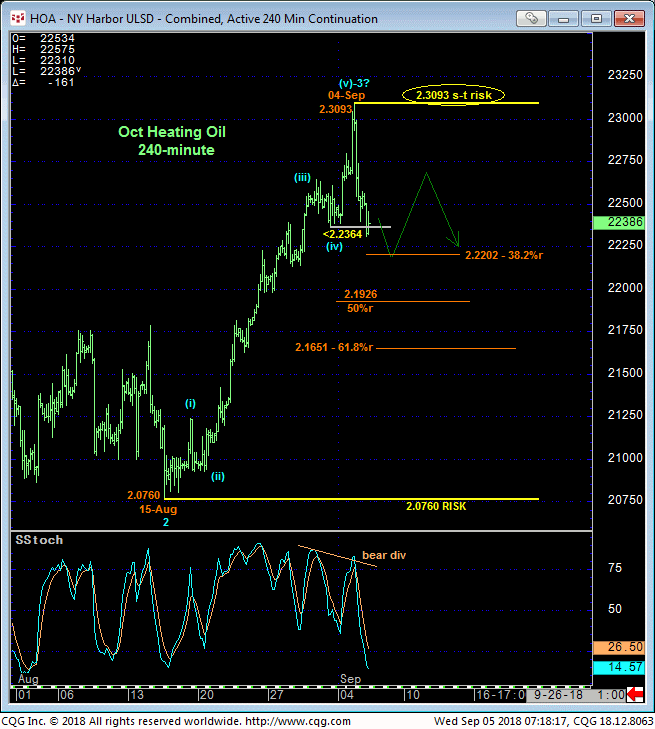
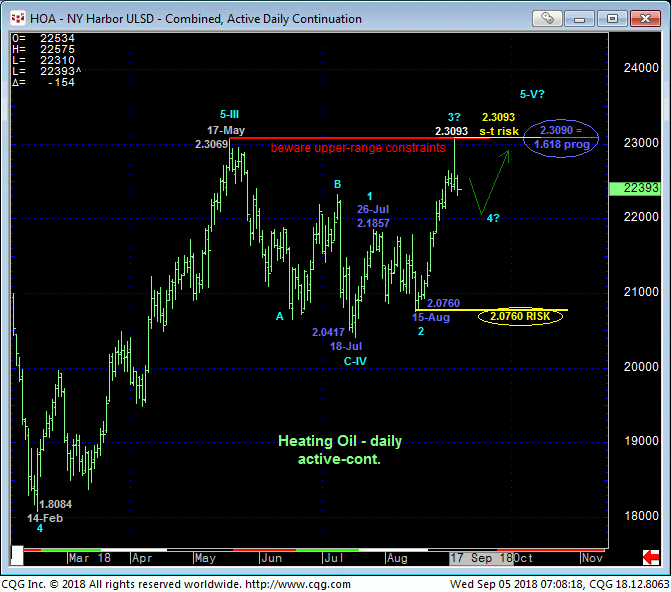
The fact that this failure stems from the extreme upper recesses of the past 3-1/2-month range and the exact (2.3090) 1.618 progression of mid-to-late-Jul’s 2.0417 – 2.1857 rally from 15-Aug’s 2.0760 low reinforces yesterday’s 2.3093 high as one of developing importance and a more reliable resistance and risk parameter. Coupled with the highest (80%) reading in the Bullish Consensus (marketvane.net) measure of market sentiment in over 10 YEARS, a more extensive, if intra-range relapse should not surprise.
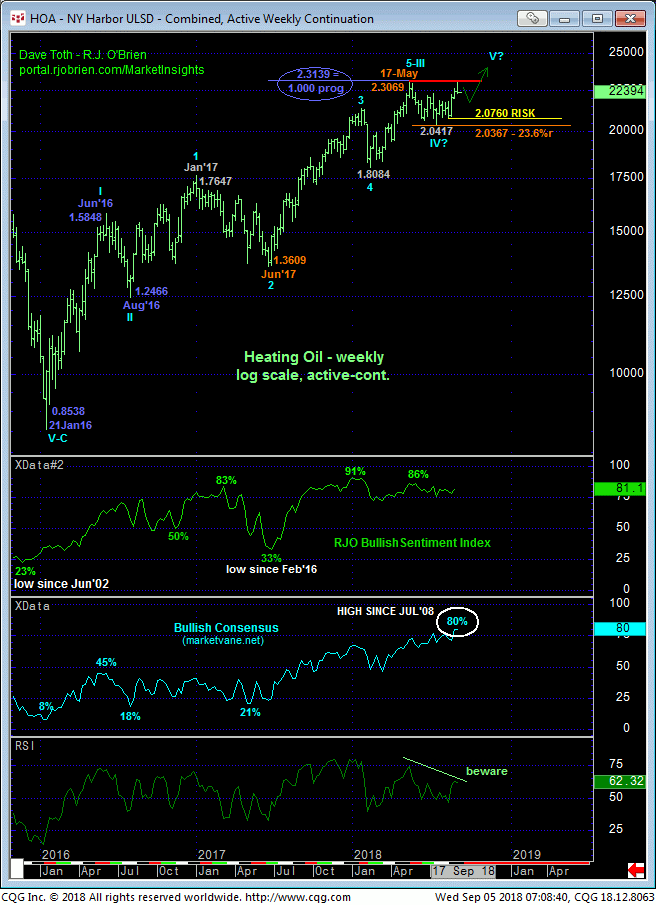
This said, and while the RATE of ascent has slowed this year, the weekly log chart below shows that this market can look back on 32 MONTHS of bull trend with May-Jul’s corrective sell-off attempt retracing only a Fibonacci minimum 23.6% of even the past YEAR’S rally from Jun;17’s 1.3609 low to 17May18’s 2.3069 high. Per such, it’s not hard to consider the past 3-1/2-months’ behavior as corrective/consolidative ahead of the eventual resumption of the secular bull with commensurately larger-degree weakness below 15-Aug’s 2.0760 next larger-degree corrective low and key risk parameter still minimally required to threaten this long-term bullish count.
These issues considered, we believe overnight’s bearish divergence in short-term momentum exposes an intermediate-term correction lower within the long-term bull trend. The depth of this suspected correction is difficult and subjective to speculate on, but we suspect the 2.22-to-2.19-range should contain this correction IF it’s not part of a resumption of the past 3-1/2-months’ consolidation that could drive prices back to the 2.10-to-2.05-area or lower. Per such, shorter-term traders have been advised to move to a neutral/sideline position while long-term players have been advised to pare bullish exposure to more conservative levels to reduce or circumvent the depths unknown of this suspected correction. We will be watchful for a countering bullish divergence in short-term mo from the 2.22-to-2.19-range to reconsider a resumed bullish policy. And needless to say a recovery above 2.3093 negates this count, reinstates the bull and exposes potentially steep gains thereafter.
OCT RBOB
The technical construct and expectations for the RBOB market are virtually identical to those detailed above in diesel following yesterday afternoon’s short-term mo failure below 1.9897. This bearish divergence in momentum defines yesterday’s 2.0624 high as the end of a 5-wave Elliott sequence from 16-Aug’s 1.8662 low ahead of at l;east a correction of this 1.8662 – 2.0624 rally. As a direct result of this short-term mo failure, yesterday’s 2.0624 high serves as our new short-term risk parameter from which non-bullish decisions like long-covers and cautious bearish punts can now be objectively based and managed.
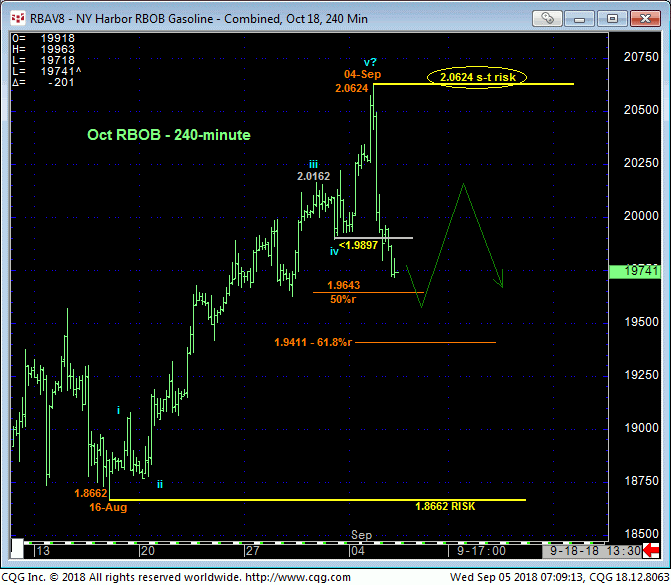
The near-term challenge however is that the market has very quickly returned to the middle-half bowels of the lateral 2.1150 – 1.8593-range that has dominated price action since 22-May’s high. Initiating directional exposure from such range-center conditions is ill-advised due to poor, coin-flip risk/reward merits.
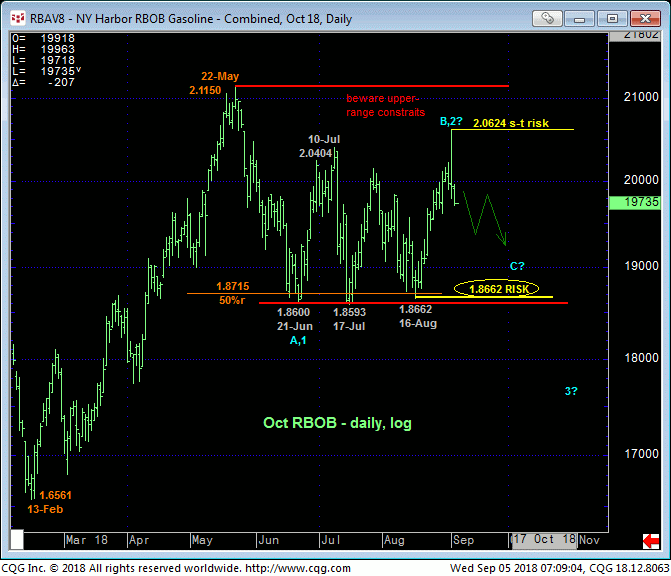
From a longer-term perspective and against the backdrop of a secular 28-month bull trend, the lateral price action from 22-May’s 2.1150 high is still advised to first be approached as a mere corrective/consolidative affair ahead of an eventual resumption of the major uptrend that preceded it. Commensurately larger-degree weakness below at least 16-Aug’s 1.8662 larger-degree corrective low and key risk parameter remains minimally required to threaten this long-term bullish count enough for even long-term players to move from a bullish policy to a neutral/sideline one.
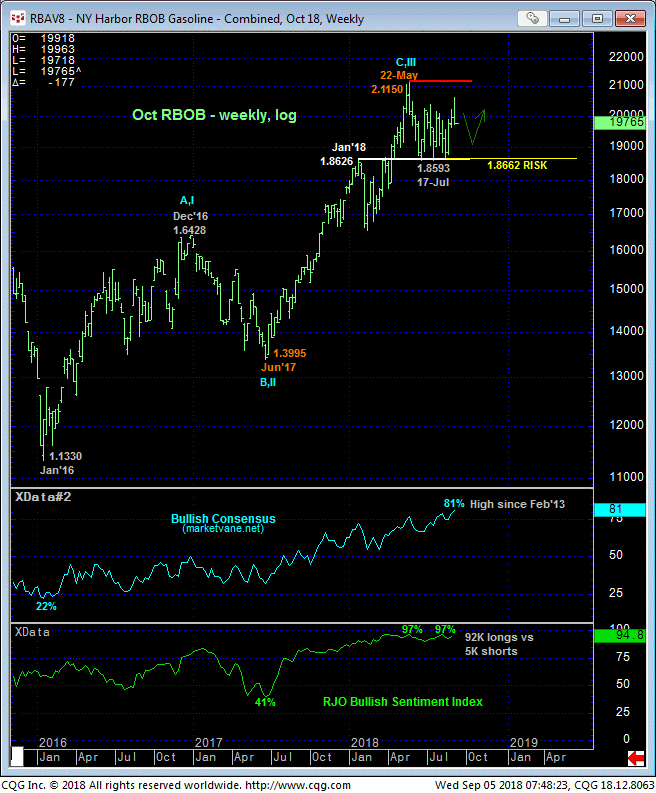
A major caveat however is extraordinarily frothy bullish sentiment that, following an admittedly short-term mo failure but from the upper-quarter of the past quarter’s range, could warn of more protracted losses ahead. Indeed, at 81%, this weekly Bullish Consensus is the highest since Feb 2013.
As with heating oil, we will be watchful for a countering bullish divergence in momentum to arrest the current intra-range relapse and potentially resurrect the broader bull. In lieu of such, further lateral-to-lower prices within the broader 3-1/2-month range are expected. Shorter-term traders have been advised to move to a neutral/sideline position while longer-term players have been advised to pare bullish exposure to more conservative levels.
OCT CRUDE OIL
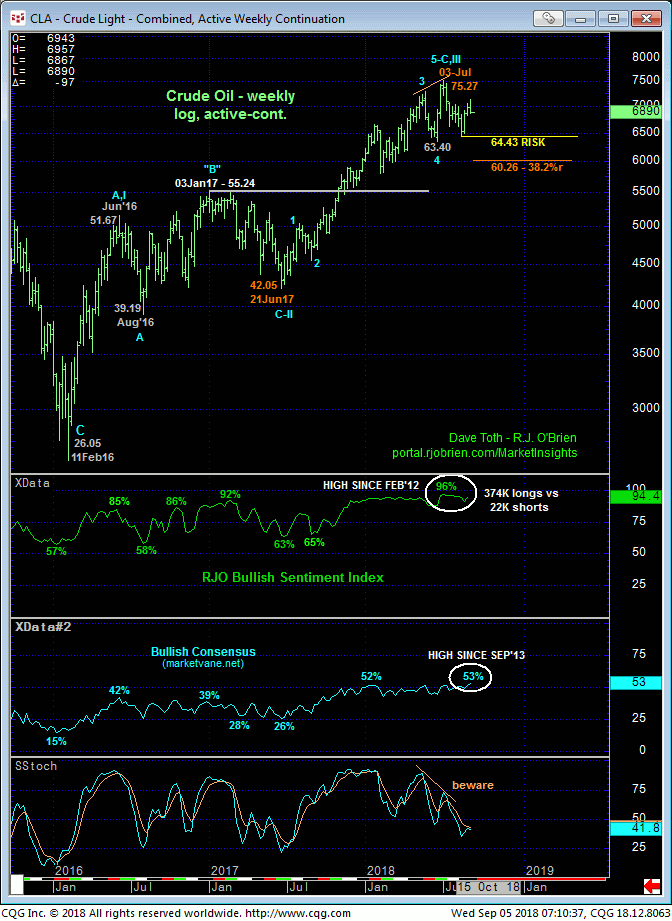
While we noted 28-Aug’s 68.21 corrective low as our previous short-term risk parameter in yesterday’s Technical Webcast, we believe the extent of yesterday afternoon and overnight’s relapse below former 70.43-to-69.31-area resistance-turned-support is sufficient to conclude yesterday’s 71.40 high as the END of a 5-wave Elliott sequence from 16-Aug’s 64.43 low and our new short-term risk parameters from which to navigate a correction or more protracted reversal lower.
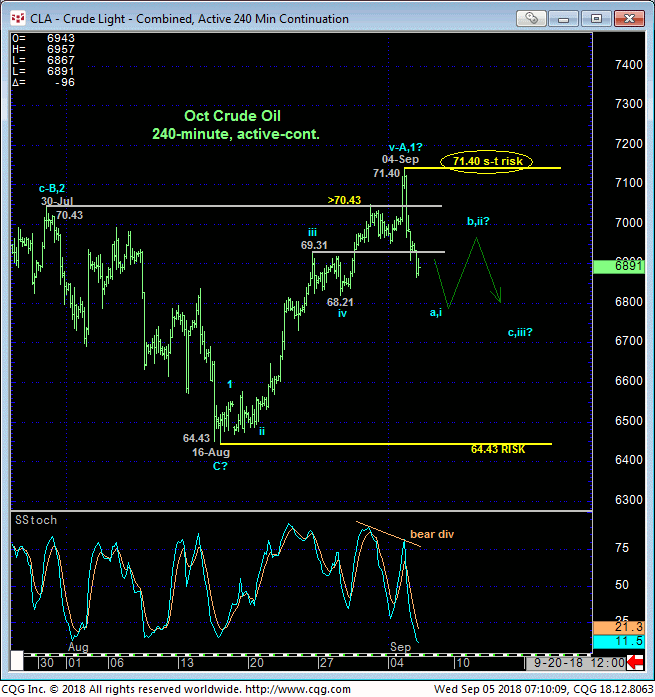
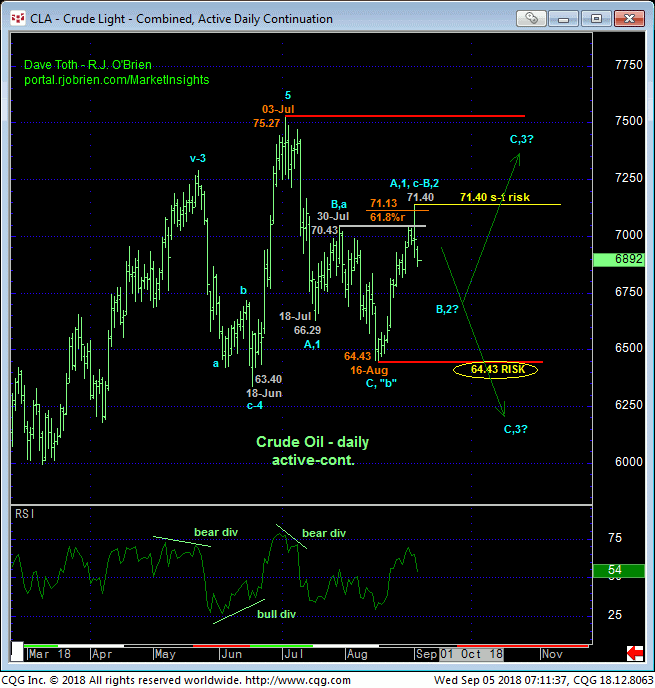
Especially against the backdrop of waning upside momentum on a weekly basis below amidst historically frothy sentiment levels, HOW the market trades lower in the period immediately ahead will be critical. For IF the recent recovery from 16-Aug’s 64.43 low is the (1st-Wave) start of a resumption of the secular bull trend, then by definition the expected setback would be expected to unfold in a more labored, corrective, 3-wave manner.
An alternate count suggests that this approximate 61.8% retracement of Jul-Aug’s 75.27 – 64.43 decline completed a new bear market correction that started with 18-Jul’s 66.29 low and included a b-Wave “irregular” down to 16-Aug’s 64.43 low as labeled in the daily chart above. If this count is correct, then the market could now be vulnerable to a trendy, impulsive and increasingly sharp collapse to levels potentially well below 64.43. In either event a recovery above yesterday’s 71.40 high and short-term risk parameter is required to negate the call and re-expose the broader bull trend.
These issues considered, shorter-term traders have been advised to move to a neutral/sideline position while longer-term players have been advised to pare bullish exposure to more conservative levels. Commensurately larger-degree weakness below 64.43 remains required for long-term players to jettison a bullish policy altogether. What lies between these two pivotal technical levels at 71.40 and 64.43 is anyone’s guess.
