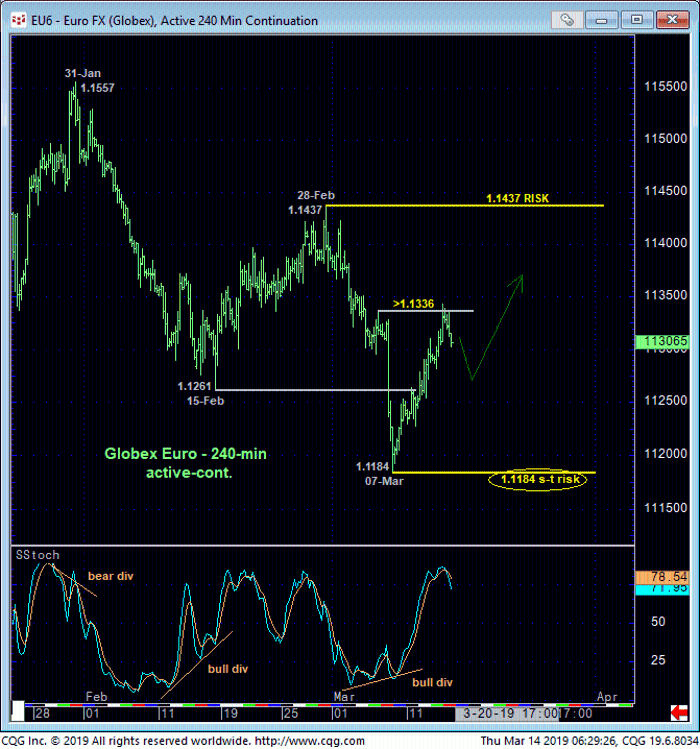
Yesterday’s recovery above our short-term risk parameter defined by 06-Mar’s 1.1336 minor corrective high confirmed a bullish divergence in short-term momentum that defined 07-Mar’s 1.1184 low as the end of the decline from 28-Feb’s 1.1437 low and our new short-term risk parameter from which shorter-term traders can objectively base non-bearish decisions like short-covers and cautious bullish punts. This tight but objective risk parameter may come in handy given a host of factors that warn of a base/reversal threat that could be major in scope, although, to be sure, commensurately larger-degree strength above 28-Feb’s 1.1437 larger-degree corrective high and key risk parameter remains minimally required to expose such a count.


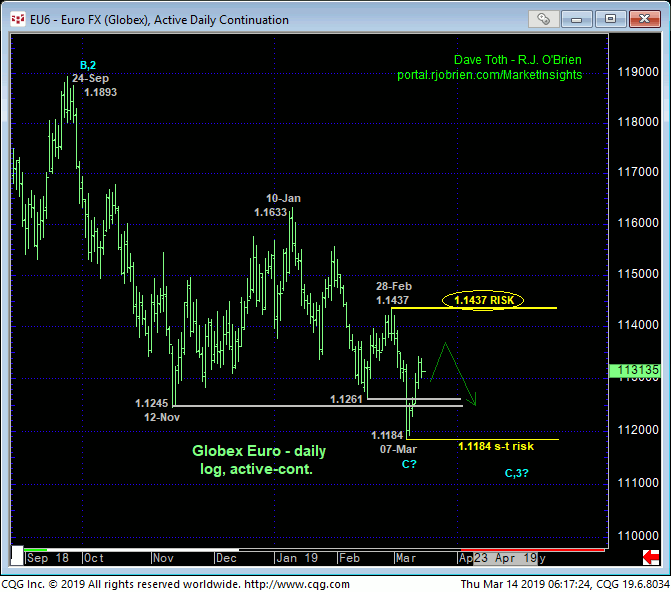
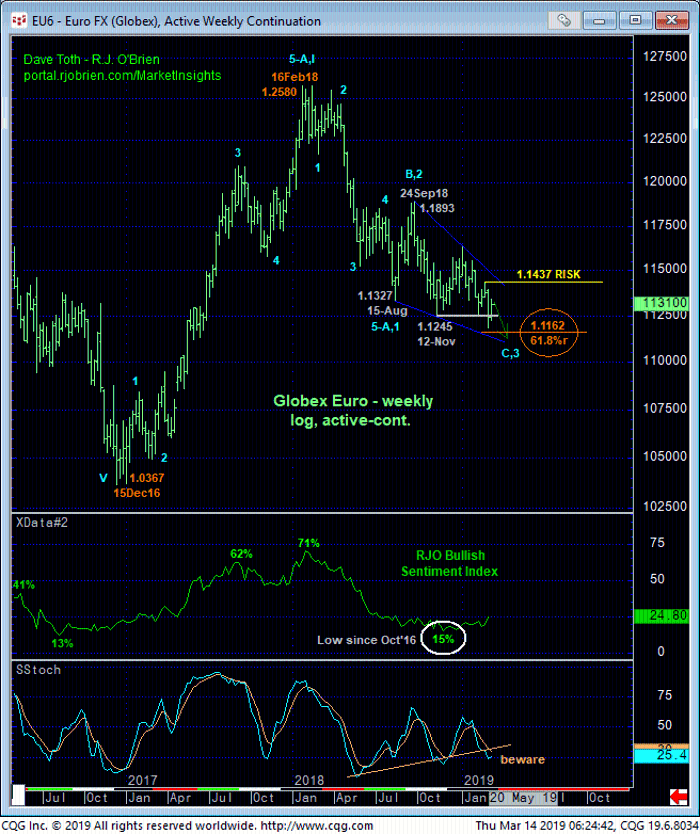
On a broader scale the daily chart above shows the staggered, 2-steps-down-1-step-up manner in which the bear has resumed from 10-Jan’s 1.1633 high. The market’s failure to sustain every new low but inability to recoup a prior corrective high is just an extension of this behavior that dates from last Jun shown in the weekly log cart below. This “falling-wedge” price action has been a trend-follower’s nightmare and, per years of observing such patterns, we believe means one of two things:
- waning downside momentum ahead of a major reversal higher or
- a sort of “coiling-up” before the downtrend accelerates sharply and obviously lower.
Herein lies the importance of 28-Feb’s 1.1437 larger-degree corrective high and key risk parameter, the recovery above which will confirm a bullish divergence in mo, break the downtrend and expose a correction or reversal higher that could be major in scope. Until and unless such 1.1437+ strength is shown, it would be premature to ignore the longer-term prospects for this market to not only continue lower, but to get destroyed.
This said and especially if the market can stay above 1.1184 and ultimately recoup 1.1437, traders must also be aware of some key factors that warn of a broader BASE/reversal count:
- waning downside momentum; confirmed above 1.1437
- historically bearish level in our RJO Bullish Sentiment Index of the hot Managed Money positions reportable to the CFTC
- the market’s proximity to the (1.1162) 61.8% retrace of Dec’16 – Feb’18’s entire 1.0367 – 1.2580 rally on a weekly log scale basis below and
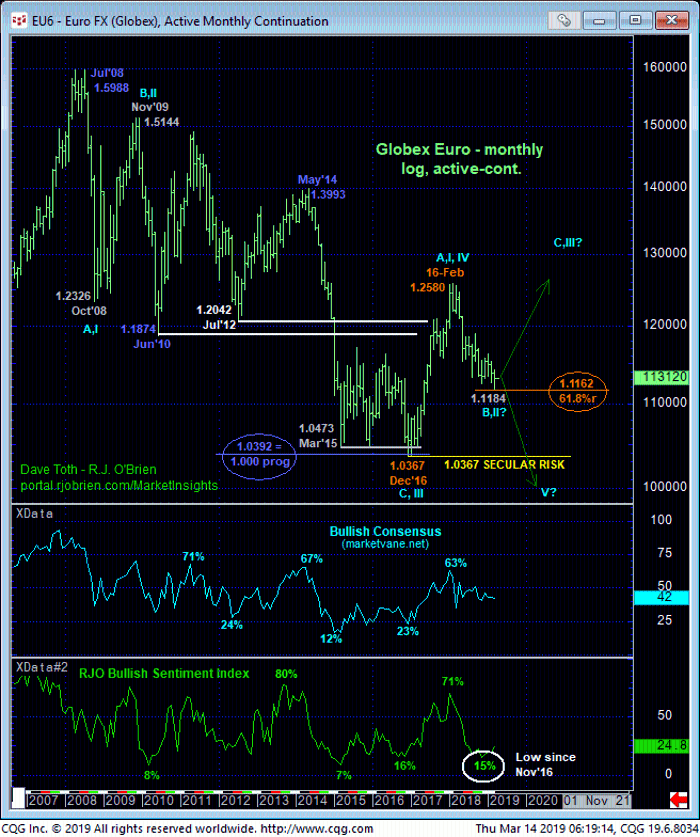
- the prospect that the market is at or near the end of a (B- or 2nd-Wave) correction of Dec’16 – Feb’18’s initial (A- or 1st-Wave) rally in a major, multi-year base/reversal process.

Again, the extent and impulsiveness of Dec’16 – Feb’18’s rally from 1.0367 to 1.2580 arguably breaks the secular downtrend, defining Dec’16’s 1.0367 low as THE END to the bear and start of a major correction or reversal higher to levels above at least 1.2580. A relapse below 1.0367 remains required to negate this call. If this long-term bullish count is correct, then the past year’s relapse is a correction that must hold somewhere above 1.0367. And what better area and condition to watch for such a corrective relapse’s end than the (1.1162-area) 61.8% retrace of the suspected A or 1st-Wave rally? If this count is wrong and Dec’16 – Feb’18’s rally as a correction within the secular bear to new lows below 1.0367, then this current slide would, at some point (soon), be expected to BEHAVE like a secular bear in a much more impulsive and obvious way.
Against this backdrop and given the factors cited above, we believe the 1.1437 and 1.1184boundaries of the past couple weeks’ range define pivotal flexion points in the period ahead. Traders are advised to toggle directional biases around these thresholds, being short below 1.1184 and long above 1.1437. The market’s current position in the middle of this range is a coin flip that presents poor risk/reward merits to directional bets.
In sum, shorter-term traders have been advised to move to a neutral/sideline policy while longer-term players remain OK to maintain a bearish policy with a recovery above 1.1437 required to negate this call and warrant switching to a new bullish policy.


