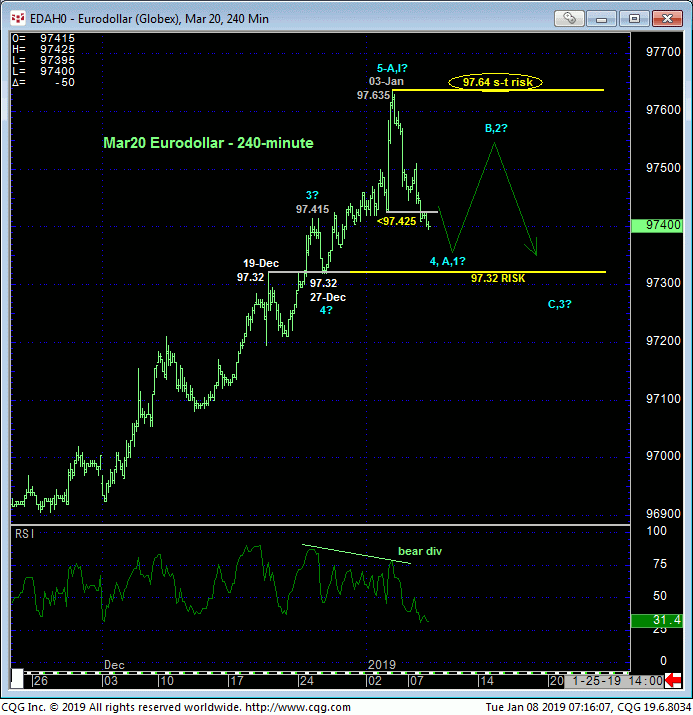
The Mar20 contract’s failure late yesterday below a minor corrective low at 97.425 from Thur is pretty nondescript. Nonetheless it confirms a bearish divergence in very short-term momentum that defines Thur’s 97.635 high as one of developing importance and possibly the END of the past quarter’s major rally. Per such we are identifying 97.64 as our new short-term risk parameter from which non-bullish decisions like long-covers and cautious bearish punts can now be objectively based and managed.


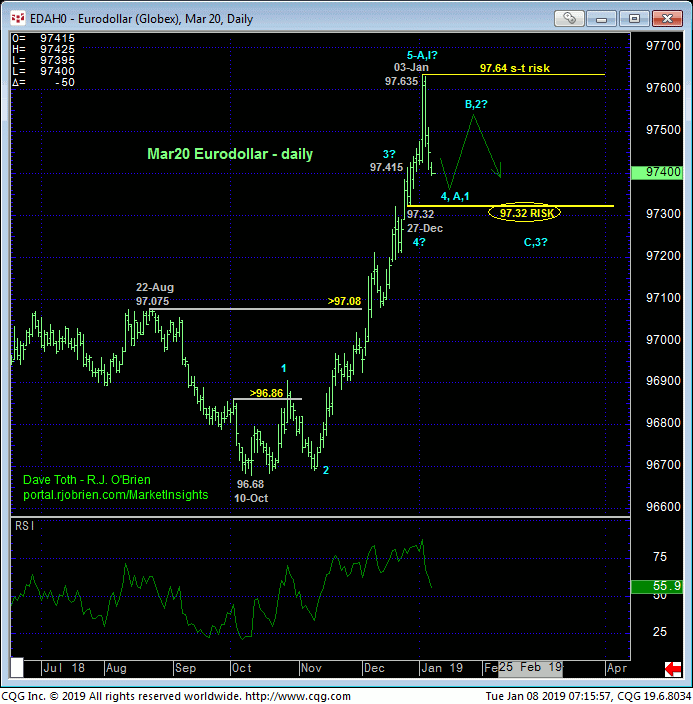
To be sure, this admittedly minor mo failure below 97.425 is of an insufficient scale to CONCLUDE the end of a 5-wave Elliott sequence up from 10-Oct’s 96.68 low as labeled in the daily chart above. This rally is extensive enough that even “commensurately larger-degree weakness” below 7-Dec’s 97.32 corrective low might still only expose a (4th-Wave) correction ahead of a subsequent (5th-Wave) resumption of the rally to another round of new highs. And we don’t want to rely on the wave count we’ve labeled in the daily chart above because it is easily indicted as “curve-fit”.
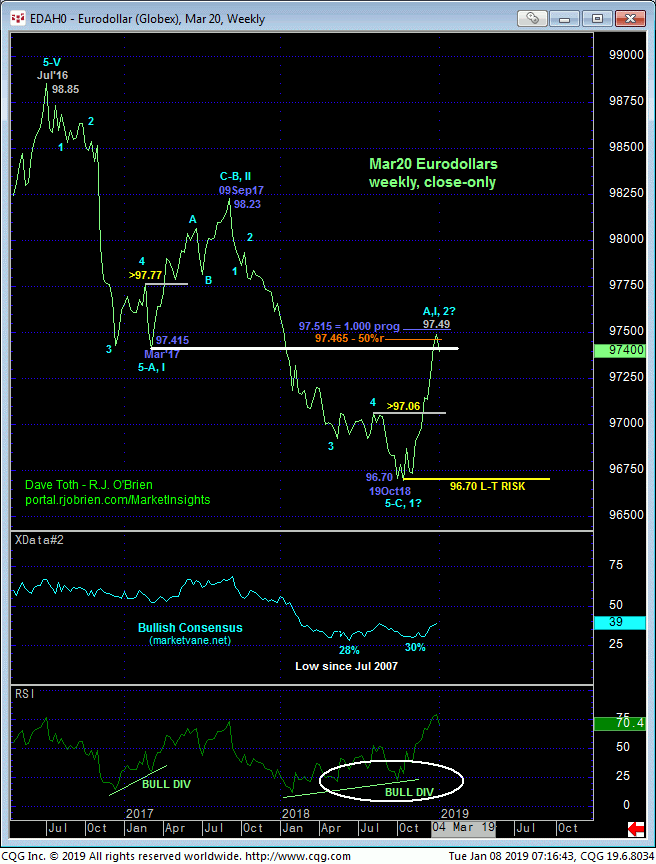
What isn’t curve fit or subjective is the market’s rejection/definition of Thur’s 97.635 high that traders can use as a tight but objective risk parameter to a bet on a 5th-wave top and more significant correction or reversal lower. Ancillary evidence in the weekly close-only chart below however contributes to the compelling prospect that Thur’s high might have ended Oct-Jan’s major rally.
We find it very intriguing that Fri’s 97.49 high weekly close is sandwiched by the (97.465) 50% retrace of Sep’17 – Oct’18’s 98.23 – 96.70 decline and the (97.515) 1.000 progression of Mar-Sep’17’s previous 97.415 – 98.23 recovery from 19Oct18’s 96.70 low. And Mar’17’s former huge 97.415-area support, since demolished in Jan’18, serves as a major new resistance candidate. That’s a lot of technical stuff cutting across around this 97.40-to-97.50-area that, COMBINED with yesterday’s admittedly short-term mo failure, is hard to ignore as a developing hurdle to a continued bullish count.
These issues considered, traders are advised to take profits on longs recommended in 09-Nov’s Trading Strategies Blog at-the-market and move to a neutral/sideline position. IF there’s a peak/reversal environment at hand, we would suspect a corrective retest of last week’s high and another bearish divergence in short-term mo to stem that recovery as reinforcing evidence to a peak/reversal count that then would present a favorable risk/reward opportunity from the bear side. Needless to say a recovery above 97.64 negates this call, reinstate the bull and exposes potentially steep gains thereafter. A hard-to-ignore sidelight of a peak/reversal count in this interest rate market is the probable friendlier count to equities given the relative inverse correlation between these two sectors of late.


