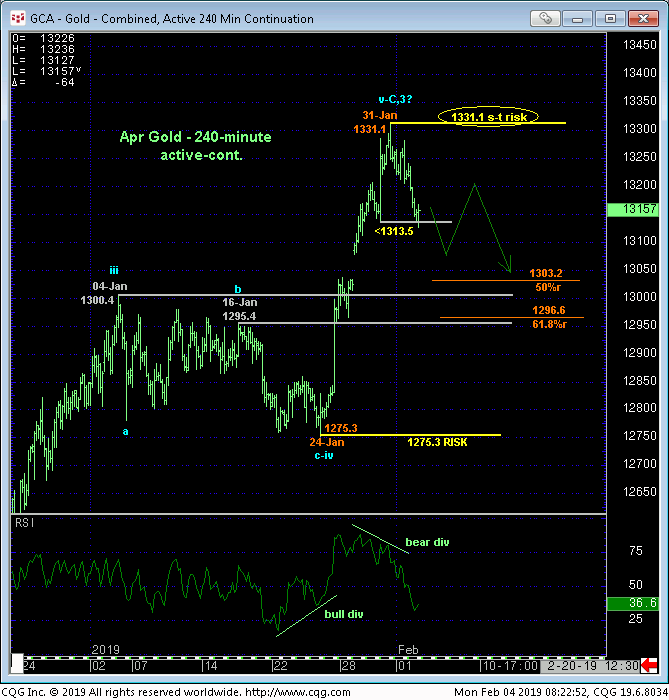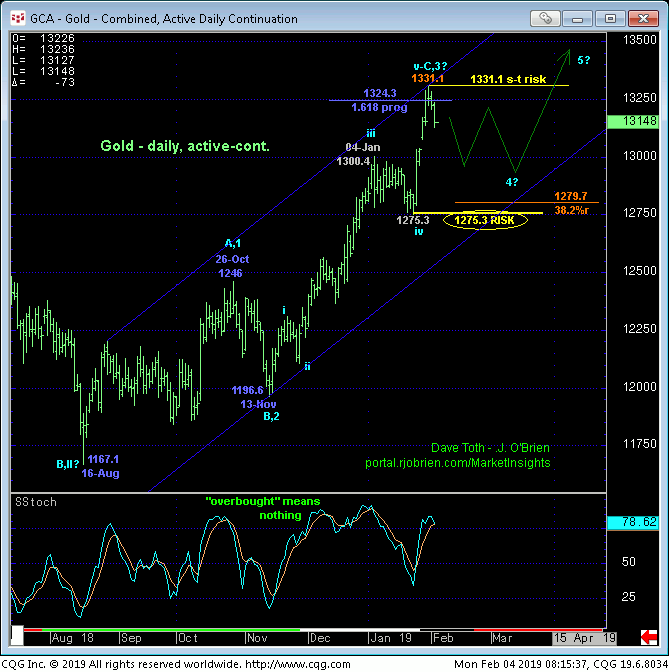
The market’s failure this morning below our short-term risk parameter defined by 30-Jan’s 1313.5 low confirms a bearish divergence in short-term momentum that leaves Thur’s 1331.1 high in its wake as one of developing importance and the likely end of the portion of the recent uptrend from 24-Jan’s 1275.3 low. Per such this 1331.1 high serves as our new short-term risk parameter from which non-bullish decisions like long-covers and cautious bearish punts can now be objectively based and managed.
The 240-min chart below also shows the 50% (1303.2) and 61.8% (1296.6) retraces of late-Jan’s 1275.3 – 1331.1 rally cutting across around the same area as former 1295-to-1300-area resistance from the first-half of Jan that would be expected to hold as new support IF the exposed setback is “just” another correction within a broader bullish count.


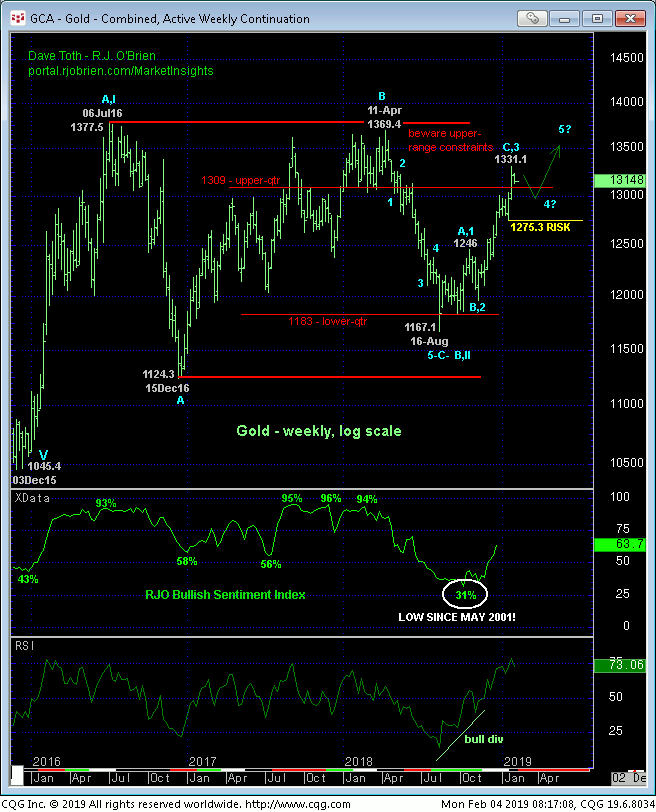
From a longer-term perspective the market has yet to fail below 24-Jan’s 1275.3 next larger-degree corrective low and our key long-term risk parameter it needs to break to, in fact, break the longer-term uptrend from even 13-Nov’s 1196.6 low, let alone the even broader bull from 16Aug18’s 1167.1 low. Indeed, this relapse could easily be a (4th-Wave) correction within the major uptrend that still has plenty of legs left in it. But even such a correction could easily span a month and retrace to the 1275-to-1280-area. Nonetheless, the market’s return to the upper-quarter of the past 2-1/2-year range that has repelled every other assault makes for a slippery slope for bulls “up here”. In effect the short-term trend is down while the long-term trend remains arguably up.
These issues considered, shorter-term traders with tighter risk profiles have been advised to neutralize bullish exposure and are even OK to take a cautious punt from the bear side with a recovery above 1331.1 required to negate this call and warrant its cover. Long-term players are advised to pare bullish exposure to more conservative levels and jettison the position altogether on a failure below 1275.3.


