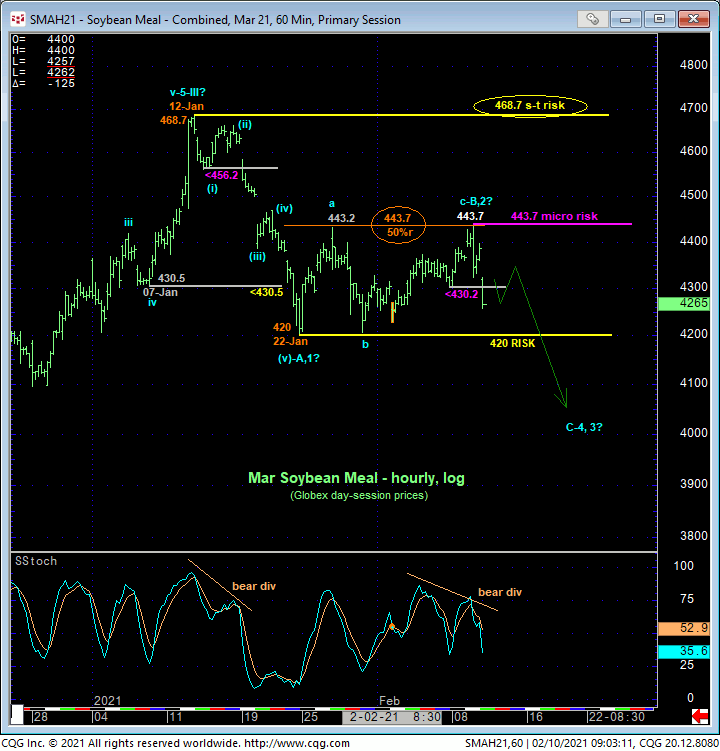
This morning’s nondescript slip below Mon’s 430.2 very minor corrective low confirms a bearish divergence in very short-term momentum as detailed in the hourly chart below. Despite its extraordinarily short-term nature however, it is a technical fact that contributes to an increasingly compelling list of factors that warn of a peak/reversal threat that could be massive in scope.
This very short-term mo failure defines yesterday’s 443.7 high as one of developing importance and a micro risk parameter from which non-bullish decisions like long-covers and cautious bearish punts can now be objectively based and managed. This 443.7 high is admittedly smack in the middle of the past month’s thus far mere lateral range that could easily be part of a broader bull market correction. HOWEVER, that 443.7 high is also the exact 50% retrace of Jan’s 468.7 – 420 decline and the top of what thus far is clearly only a 3-wave recovery from 22-Jan’s 420 low. Left unaltered by a recovery above 443.7, this 3-wave recovery is considered a corrective/consolidative affair that warns of a resumption of Jan’s downtrend that preceded it. And once below 22-Jan’s pivotal 420 low, the market’s downside potential thereafter is indeterminable and potentially extreme. But these points are just the start of a very unique and compelling list that warns that the major bull from last May’s 281.5 low may be over.


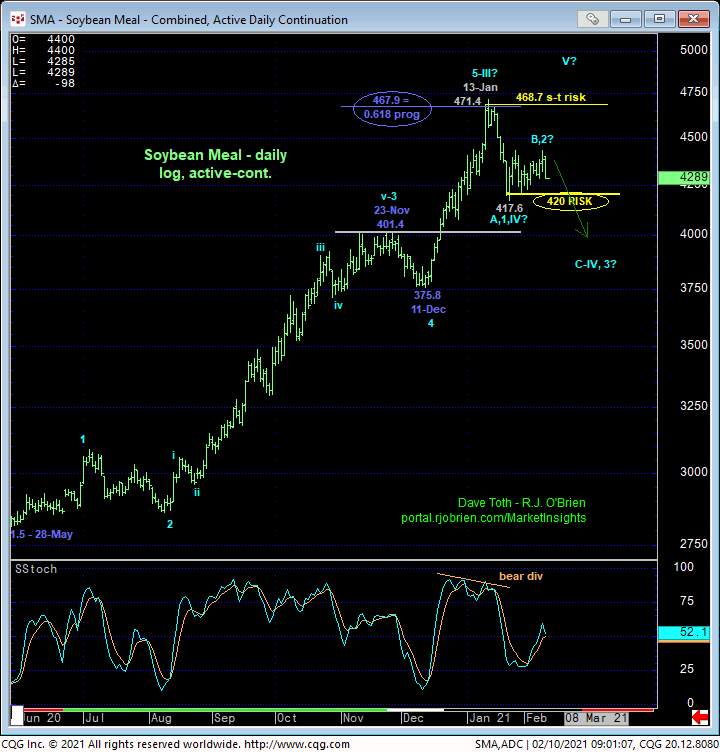
In recent updates, we’ve already discussed 22-Jan’s bearish divergence in daily momentum as defining 12-Jan’s 468.7 Globex day-session high as the prospective END to a major 5-wave Elliott sequence up from last May’s 281.5 low as labeled in the daily log active-continuation chart above and weekly log chart below. The Fibonacci fact that the suspected 4th-Wave rally from 11-Dec’s 375.8 low spanned a length almost exactly 61.8% (i.e. 0.618 progression) of the net distance of Waves-1-thru-3 (281.5 – 401.4) would seem to reinforce this count.
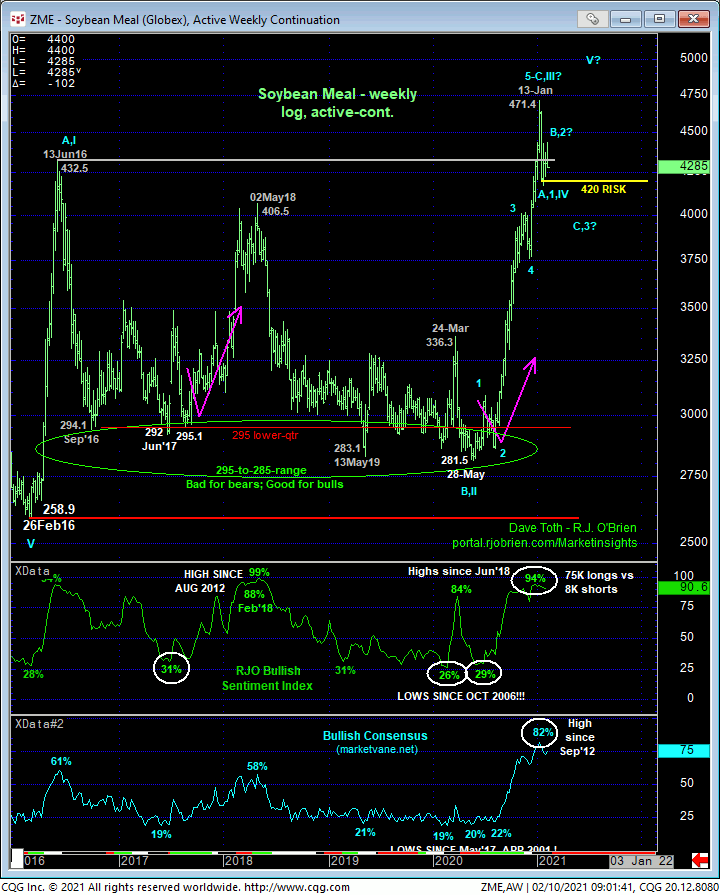
Also typical of major peak/reversal environments is historically frothy bullish sentiment/contrary opinion. Only a glance at the weekly chart below is needed to see that sentiment has reached such historical heights that, in the case of the Bullish Consensus marketvane.net), haven’t been seen since those that warned of and accompanied 2012’s all-time high and massive reversal.

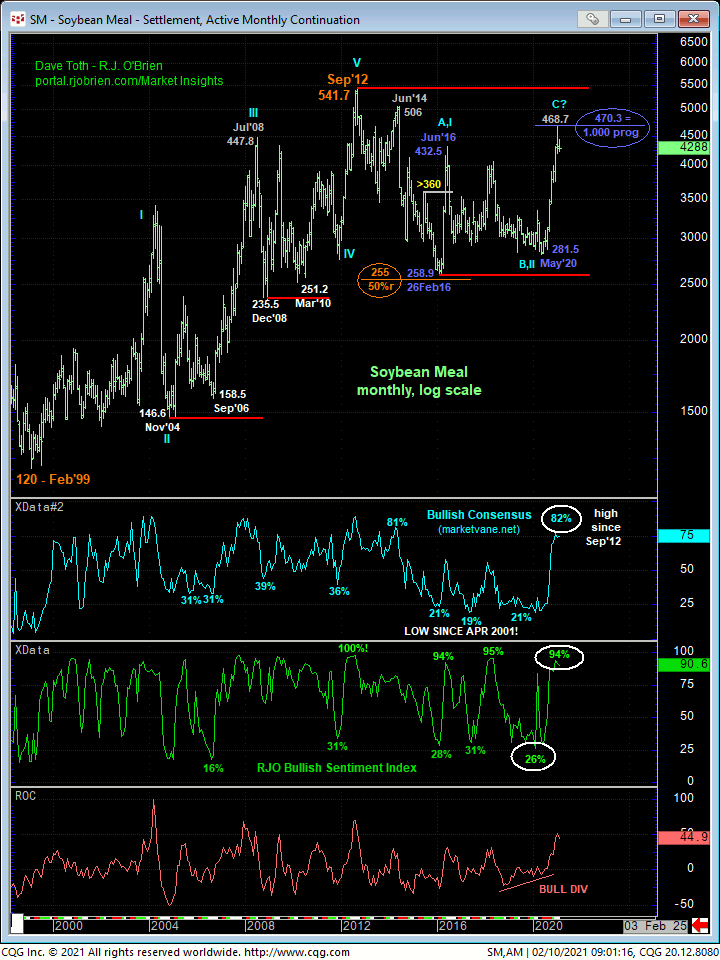
And finally, the monthly log active-continuation chart below shows that the major rally from last Mat’s 281.5 low came within $2.0 of the (470.3) 1.000 progression of Feb-Jun’16’s initial counter-trend rally from 258.9 to 432.5. This is a remarkable Fibonacci relationship fact that, combined with the admittedly shorter-term peak/reversal facts cited above, contributes to a very unique and compelling peak/reversal-threat environment and opportunity.
These issues considered, shorter-term traders and long-term commercial players are advised to reverse into a new bearish policy and exposure on the immediate failure below 420.0 with a subsequent recovery above 443.7 required to negate this specific call and re-expose the major bull. If/when the market breaks 420.0, its downside potential thereafter could be extreme.


