Posted on Jan 09, 2023, 09:32 by Dave Toth
Fri afternoon and overnight’s recovery above 22-Dec’s 3920 high and our short-term bear risk parameter discussed in Thur’s Technical Blog confirms a bullish divergence in short-term momentum that defines 22-Dec’s 3788 low as the end of the slide from 13-Dec’s 4180 high and start of what we suspect is a (B- or 2nd-Wave) corrective rebuttal to Dec’s 4180 – 3788 decline. Per such, this 3788 level serves as our new short-term risk parameter from which shorter-term traders with tighter risk profiles can objectively base non-bearish decisions like short-covers and cautious bullish punts.
With the intermediate-term trend confirmed as up, the past couple days’ component of it is either only the c-Wave of a bear market correction OR the 3rd-Wave of a more protracted move higher. In the latter, bullish count, clear and former 3900-to-3920-area (prospective 1st-Wave) resistance would now fully be expected to hold as new near-term support ahead of further, trendy, impulsive and increasingly obvious behavior to the upside. A failure back below 3900 won’t necessarily negate this bullish count and confirm the former bearish count, but it’d be an early indication of it, with subsequent weakness below 3788 confirming the bear. A recovery-countering bearish divergence in short-term momentum from a level shy of 4180 and perhaps from the 3980-to-4026-area (50% and 61.8% rets) would also be an early indication of a resumed broader bearish count. In lieu of such a mo failure and/or a relapse below at least 3900, further lateral-to-higher prices are expected.


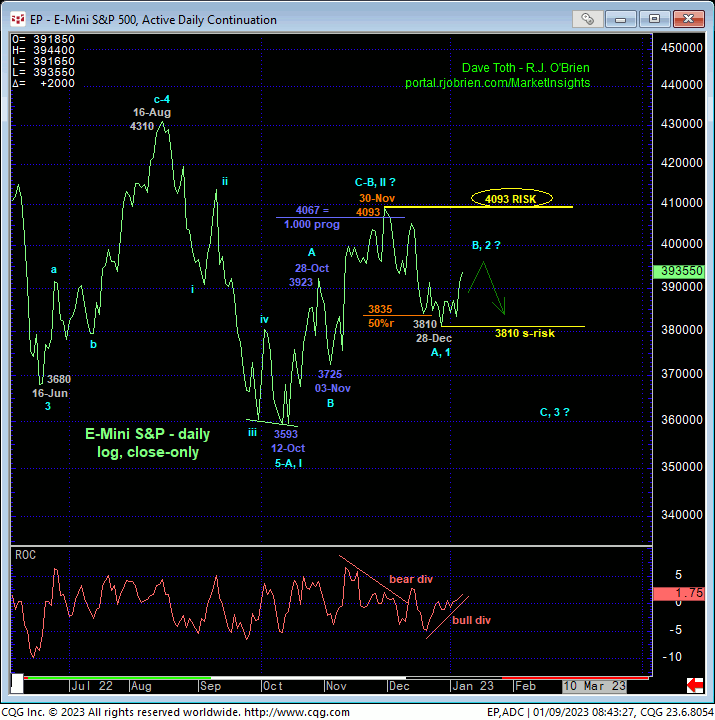
Stepping out to a daily scale however, the combination of 15-Dec’s bearish divergence in momentum that broke Oct-Dec’s uptrend and a trendy, impulsive decline from 13-Dec’s 4180 day-session high (above) and/or 30-Nov’s 4093 high close (below), the past couple weeks’ recovery attempt falls well within the bounds of a not unexpected (B- or 2nd-Wave) correction within the past year’s still-arguable long-term downtrend. To negate this longer-term bearish count, the market needs to close above 4093 and/or trade intra-day above 4180.
Traders are reminded that Oct-Dec’s recovery attempt is virtually identical in length and time to Jun-Aug’s preceding bear market correction (i.e. 1.000 progression) and looks to be a 3-wave affair as labeled in the daily high-low chart above and close-only chart below. Left unaltered by a recovery above 4093 and/or 4180, this 3-wave rebound is considered another corrective/consolidative event that warns of a resumption of Jan-Oct’22’s downtrend that preceded it. Along these longer-term bearish lines and as mentioned above, we will keep a keen eye on MOMENTUM in the days/week immediately ahead where a short-term mo failure will arrest this recovery and re-expose the downside.

From an even longer-term perspective, the weekly chart below shows the importance of 13-Dec’s 4180 high, THE level this market needs to recover above to break 2022’s major downtrend, confirm the long-term trend as up and expose at least a larger-degree correction of 2022’s entire downtrend OR a resumption of the secular bull trend to new highs above 4808. Until such commensurately larger-degree strength is proven, Oct-Dec’s 3-wave, 50% retracement of Jan-Oct’s 4808 – 3502 decline still falls within the bounds of a broader bear market correction.
These issues considered, shorter-term traders have been advised to move to a neutral/sideline position. The market’s return to the middle-half bowels of the past month’s range presents poor risk/reward metrics to initiate directional exposure. Long-term players and investors remain advised to maintain a bearish policy with a weekly close above 4093 and/or an intra-day recovery above 4180 required to neutralize any/all bearish exposure and reconsider a reversal into a cautious bullish policy. We will be watchful for a recovery-stemming bearish divergence in short-term mo over the course of the next week or so and update traders accordingly.


