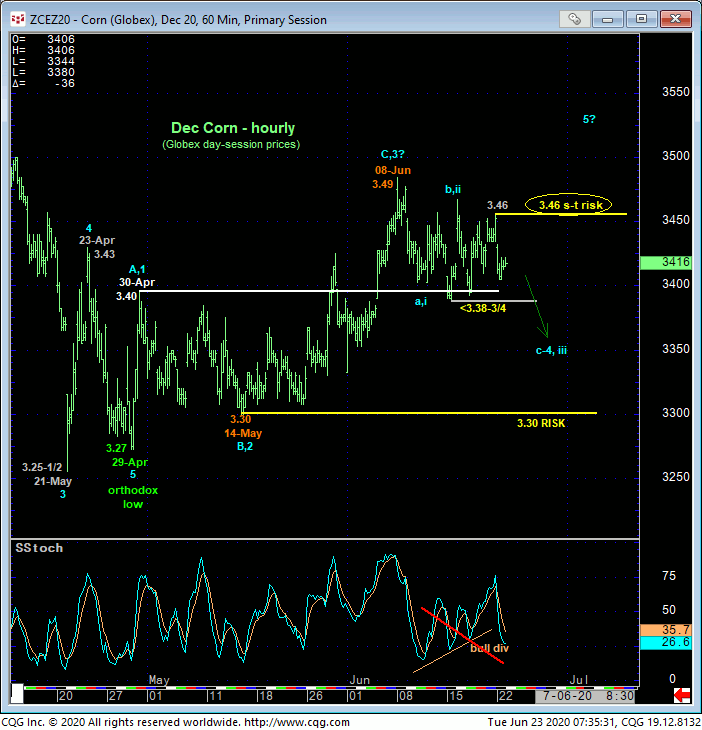
Although the hourly chart of Globex day-session prices below does not yet reflect it, overnight the market broke 15-Jun’s 3-38-3/4 low and our short-term risk parameter, trading as low as 3.34-1/2 before recovering a bit to around 3.38 currently. Whether overnight’s spasm is a falsie or the start of something bigger for the bear remains to be seen. A resulting technical fact however is the market’s definition of Fri’s 3.46 high as THE high the market would now be expected to sustain losses below if it’s got something broader to the bear side in mind and THE high the bull needs to recoup to render the sell-off attempt from 08-Jun’s 3.49 high a 3-wave and thus corrective affair consistent with our preferred broader base/reversal count. Per such, this 3.46 level becomes our new short-term risk parameter around which shorter-term traders with tighter risk profiles are advised to toggle directional biases and exposure.


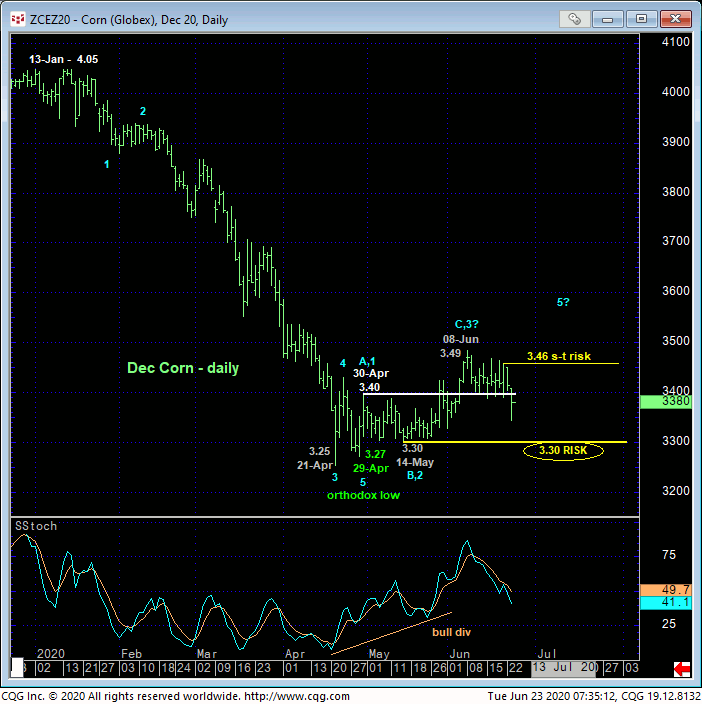
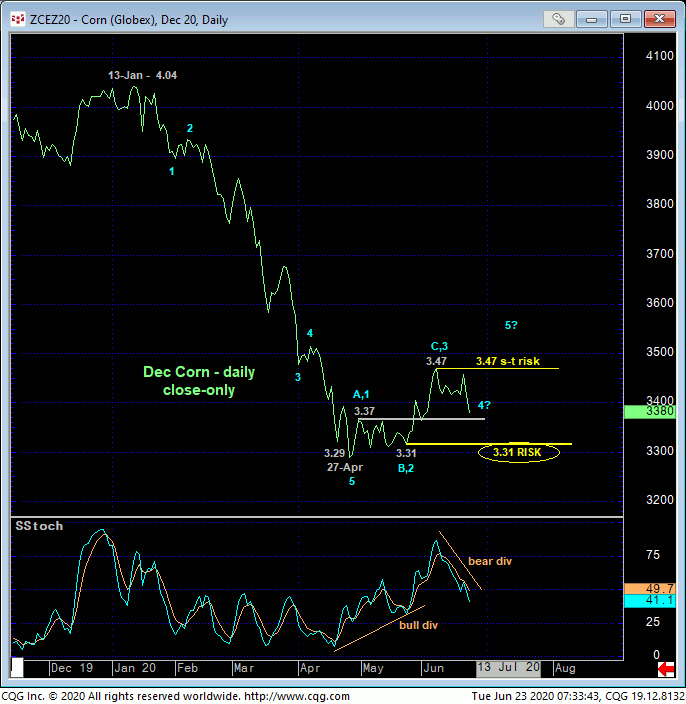
Admittedly, from a longer-term perspective, the past couple months’ price action from 27-Apr’s 3.29 low close (below) and/or 29-Apr’s 3.27 intra-day orthodox low may still be considered as EITHER a mere bear market correction relative to the scope of Jan-Apr’s major decline OR part of a major base/reversal process. On this scale however, late-May/early-Jun’s component of this recovery still leaves 14-May’s 3.30 low in its wake (22-May’s 3.31-3/4 low close) as the larger-degree corrective low the market needs to break to confirm Apr-Jun’s recovery as a 3-wave and thus corrective affair that would then re-expose Jan-Apr’s downtrend that preceded it. Per such, these levels remain intact as our key long-term risk parameters from which longer-term players can objectively base and maintain the risk of a still-advised bullish policy and exposure. In effect then, we believe the market has identified 3.30 and 3.46 as the key directional triggers heading forward.

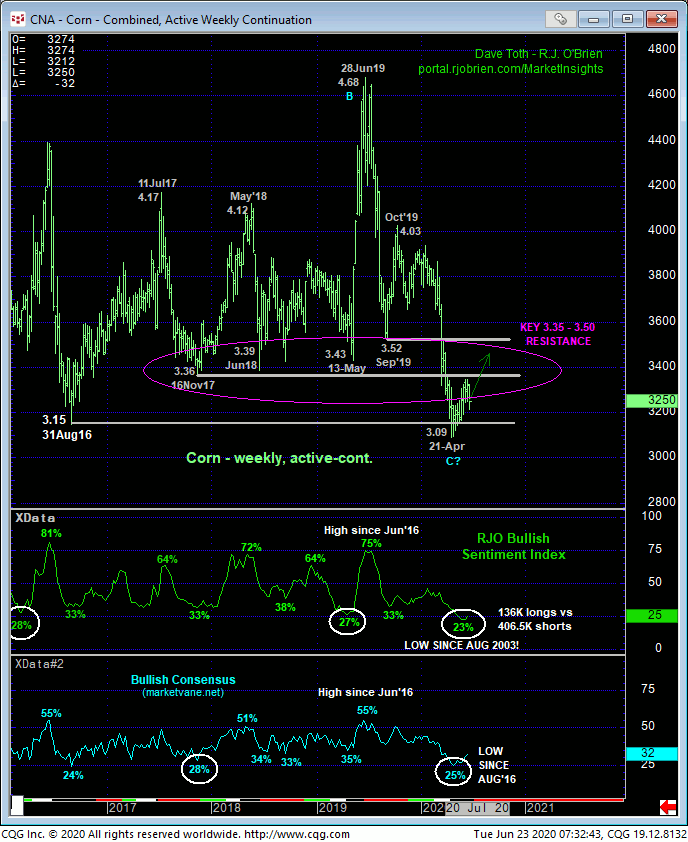
From an even longer-term perspective however, the weekly active-continuation chart below shows the market’s current flirtation with the 3.50-to-3.15-area that has provided support and repelled all sell-off attempts since Oct 2014 amidst historically bearish sentiment/contrary opinion levels typical of virtually all major BASE/reversal environments. These remain two key contributing facts to our longer-term base/reversal bias until threatened by a relapse below at least 3.30. Indeed, with our proprietary RJO Bullish Sentiment Index showing a near 17-year low of 25% reflecting a mere 136K Managed Money long positions to a whopping 406K shorts, it would not be hard to find fuel for upside vulnerability if/when this market recovers above 3.46 and especially 3.49.
Now this chart also shows the ton of former support around the 3.40-to-3.50-area that, since broken in Mar/Apr, now serves as a new resistant concern. 08-Jun’s 3.49 high shows this former support thus far playing its new role of resistance well, defining this 3.49 threshold as a likely gateway to our broader base/reversal count.
These issues considered, a bullish policy remains advised for long-term players with a relapse below 3.30 required to negate this call and warrant its cover. By contrast, today’s apparent slip below our short-term risk parameter at 3.38 warrants a move to the sidelines by shorter-term trader with a recovery above 3.46 negating any short-term bearish count and resurrecting our broader base/reversal count. In effect, traders are advised to toggle directional biases and exposure around the key 3.46 and 3.30 flexion points commensurate with their personal risk profiles.


