Posted on Aug 18, 2023, 11:44 by Dave Toth
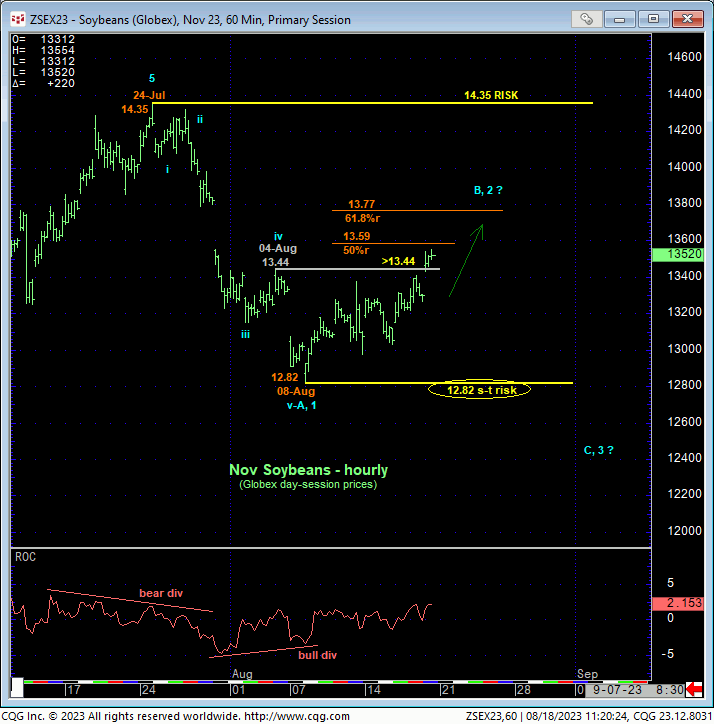
The market’s recovery today above 04-Aug’s 13.44 minor corrective high and our short-term risk parameter discussed in 07-Aug’s Technical Blog confirms a bullish divergence in short-term momentum and defines 08-Aug’s 12.82 low as the 5th-Wave end to the slide from 24-Jul’s 14.35 high. As a result, 08-Aug’s 12.82 low becomes our new short-term parameter from which the risk of non-bearish decisions like short-covers can be objectively based and managed by shorter-term traders with tighter risk profiles.
Against the backdrop of our broader peak/reversal bear market count, this recovery is advised to first be approached as a mere (B- -r 2nd-Wave) correction within a broader move south. If this count is correct, then we would expect a recovery-countering bearish divergence in short-term momentum somewhere between spot and 24-Jul’s 14.35 key high and long-term bear risk parameter, and perhaps somewhere around the areas of the (13.59) 50% retrace of Jul-Aug’s 14.35 – 12.82 decline or (13.77) 61.8% retrace. Until and unless such a mo failure arrests this clear and present recovery however, these merely “derived” Fibonacci levels are NOT considered resistance or a reason to sell into this recovery (unless you’re a longer-term player and acknowledge and accept the risk of doing so to 14.35).
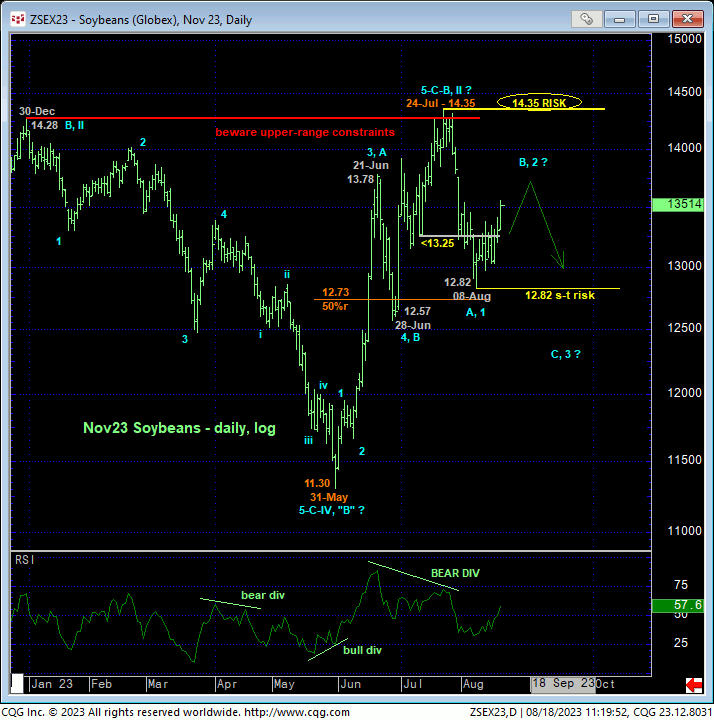
From a longer-term perspective, commensurately larger-degree strength above 24-Jul’s 14.35 high remains required to negate our long-term bearish count discussed in 31-Jul’s Technical Blog. The 5-wave impulsive extent of Jul-Aug’s decline, rejection of the extreme upper recesses of the past year’s range in the Nov23 contract and and historically extreme bullish sentiment/contrary opinion levels remain as key elements to this bearish count. It is very much worth keeping this longer-term bearish count in mind, for if/when the market arrests the current recovery attempt as a 3-wave and thus corrective affair, we would then anticipate a resumption of not only Jul-Aug’s downtrend to levels below 12.82, but also a resumption of the secular bear trend from 2022 highs to new lows below 11.30, similar to the corn market’s late-Jul/early-Aug collapse.
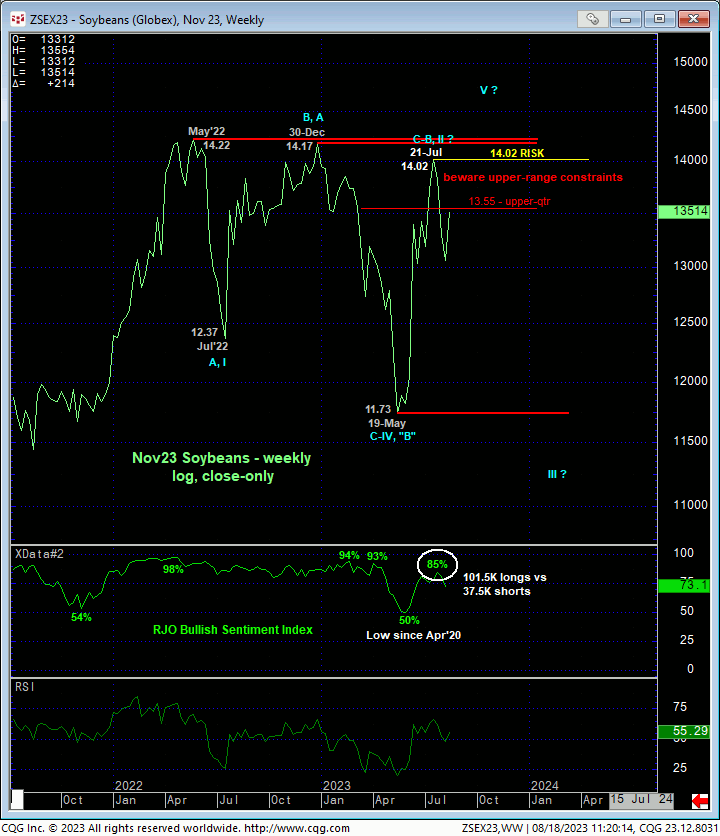
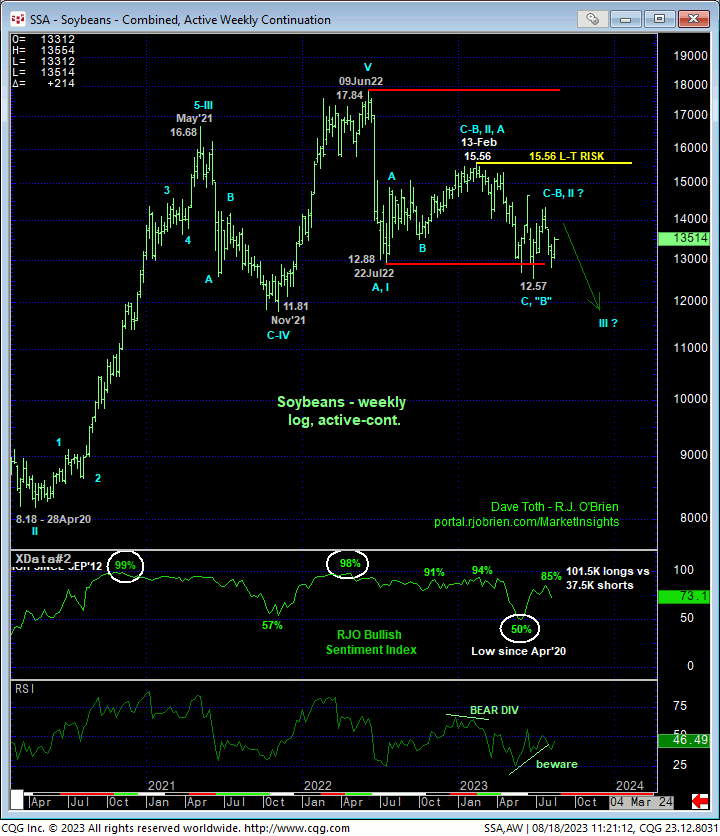
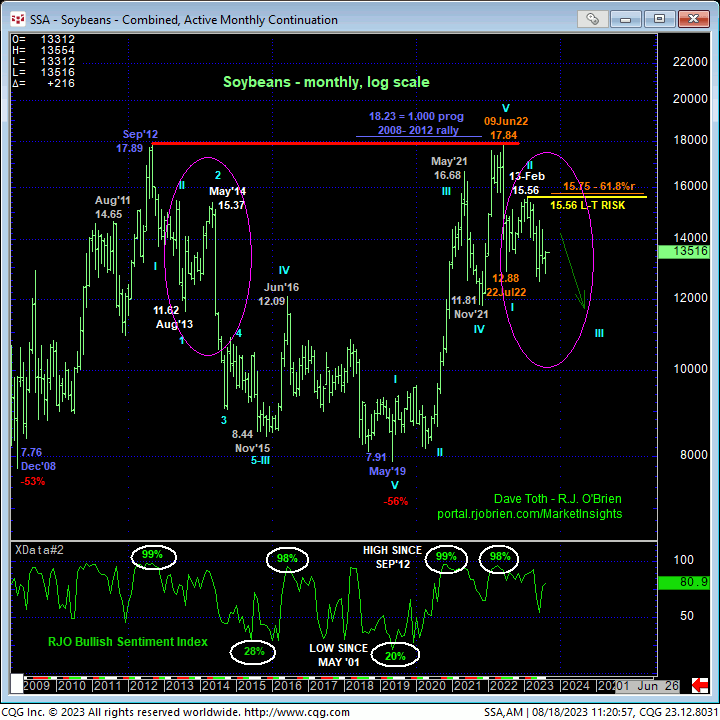
Finally, on an active-continuation basis, the weekly (above) and monthly (below) log scale charts show the same multi-quarter peak/reversal process from last year’s 17.84 high as that that warned of and accompanied 2012’s major top and reversal. We’ve discussed this process since the extent and 5-wave impulsiveness of Jun-Jul’22’s initial counter-trend decline and the market has yet to produce the gains to negate it. The Nov’23 contract needs to recoup at least 24-Jul’s 14.35 high to threaten the count that suggests the bean market is in a new secular bear market. And on an active-continuation basis, the prompt contract needs to recoup Feb’s 15.56 high.
These issues considered, a bearish policy remains advised for longer-term commercial players with a recovery above 14.35 required to threaten this call enough to warrant moving to the sidelines. Shorter-term traders with tighter risk profiles have been advised to move to a neutral/sideline position to circumvent the heights unknown of a suspected correction of late-Jul/early-Aug’s 14.35 – 12.82 decline. We will keep a keen eye on any recovery-countering bearish divergence in short-term mo around the 13.50-to-13.77-area to present a preferred risk/reward opportunity to reset bearish exposure ahead of what could be protracted losses the rest of the year.
