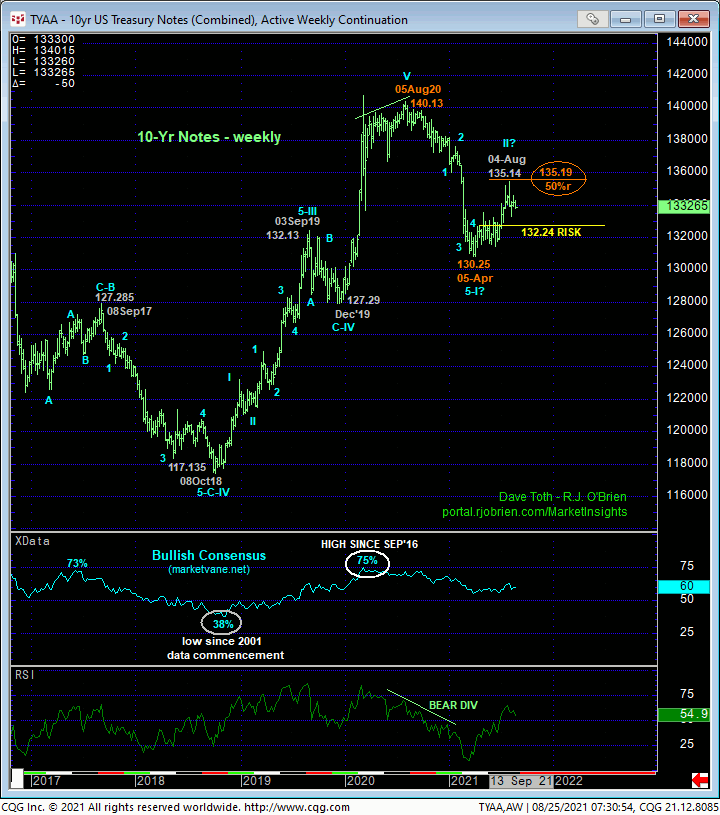

For most of the past few months we’ve acknowledged the developing recovery in this market that warranted an interim bullish approach. We say “interim” due to the ultimately bearish prospect that this recovery is just a (probable 2nd-Wave) correction within a massive peak/reversal process that dates from Aug’20’s 140.13 all-time high. In 10-Aug’s Technical Blog we discussed the prior day’s bearish divergence in short-term momentum below 133.27 that identified 04-Aug’s 135.14 high as the END of the uptrend from 17-Jun’s 131.14 low and our new short-term risk parameter from which shorter-term traders with tighter risk profiles could objectively base non-bullish decisions like long-covers.
Today, the 240-min chart above shows the relapse below last Wed’s 133.29 low that confirms another bearish divergence in short-term momentum identifying 17-Aug’s 134.195 high as the end of the recovery from 11-Aug’s 133.095 low. The Fibonacci fact that that high was also the exact 61.8% retrace of early-Aug’s 135.14 – 133.095 decline reinforces this 134.195 high as one of developing importance and another mini risk parameter from which traders can objectively base non-bullish decisions like long-covers and cautious bearish punts. To mitigate a bearish count that could have long-term consequence, this market needs to recover above at least 134.195. And to reaffirm the 5-month recovery, it needs to recover above 04-Aug’s 135.14 high. Until such strength is proven, it would not be a stretch to suggest that that 135.14 high completed a major 2nd-Wave correction ahead of what could be monstrous downside potential.
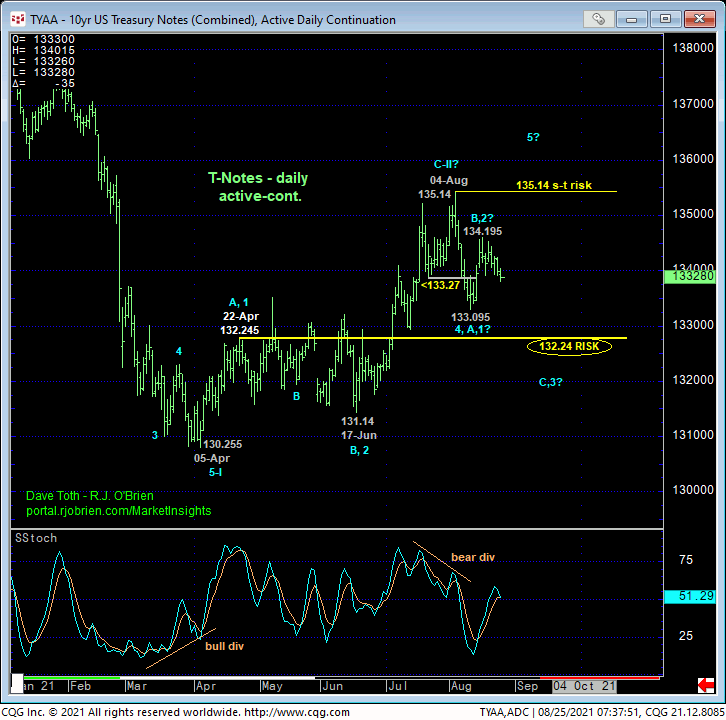
Acknowledging technical and trading SCALE however, commensurately larger-degree weakness below a huge area of former resistance-turned-support between 22-Apr’s 132.245 prospective 1st-Wave high and 133.06 is required to render the entire recovery attempt from 05-Apr’s 130.255 low a 3-wave and thus corrective affair that would reinforce our major bearish count from last year’s high. Per such, we’re defining 132.24 as our new long-term risk parameter from which longer-term institutional players can objectively rebase and manage the risk of a still-advised bullish policy and exposure. In effect, we believe this market has boiled down the two key flexion points to 132.24 and 134.195.

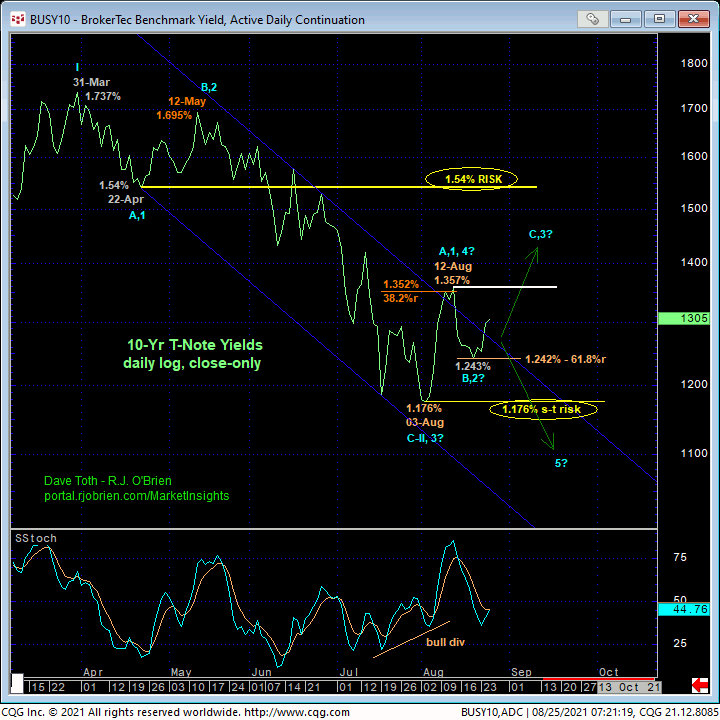
On a 10-yr yield basis below, we’ve already acknowledged 12-Aug’s 1.357% high as a possible 4th-Wave correction within a still-arguable downtrend from 31-Mar’s 1.737% high, especially given the Fibonacci fact that the recovery from 03-Aug’s 1.176% low staled around the exact and minimum 38.2% retrace of the prospective 3rd-wave down from 12-May’s 1.695% high. To flip the script on a count calling for lower yields, this market’s got to recover above at least 12-Aug’s 1.357% high. Even more, a recovery above 22-Apr’s 1.54% prospective 1st-Wave low is required to negate the impulsive integrity of a broader bearish count.
This said, traders are also reminded that 06-Aug’s bullish divergence in momentum defines 03-Aug’s 1.176% low as one of obvious importance and THE level this market now needs to break to resurrect a broader bearish count. The fact that mid-Aug’s relapse attempt stalled at the exact 61.8% retrace of the initial 1.176% – 1.357% rise provides a little bit of evidence in support of a developing BASE/reversal process in yields over the past month or so.
Now again, against the backdrop of a FIVE MONTH decline in yields, today’s scant rebound is grossly insufficient to conclude a more extensive recovery or reversal higher in rates. Indeed, further strength above 12-Aug’s 1.357% high is minimally required to reinforce a count calling for a potentially protracted rate rise. But until yields drop below at least 1.243%, traders are warned to be on the lookout for such a 1.357%+ move next. In effect, we believe the market has zeroed in on 1.243% and 1.357% as tight but key flexion points around which to toggle directional biases and exposure.

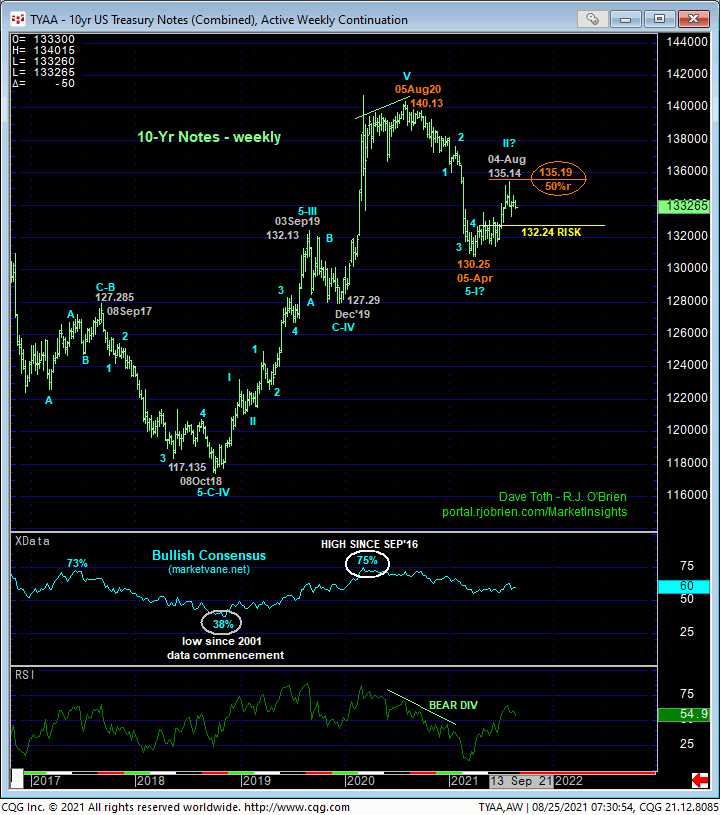
Finally, from a long-term perspective and as discussed numerous times since we ramped up our major peak/reversal count in 09Nov20’s Technical Blog, the weekly chart of the contract below shows the magnitude of Aug’20 – Apr’21’s reversal. On this scale, it’s easy to see the ultimately long-term bearish count that suggests the 5-month recovery is just a major 2nd-wave correction. The Fibonacci fact that this recovery has thus far retraced exactly 50% of Aug’20 – Apr’21’s 140.13 – 130.25 decline may or may not contribute to a resumed bearish count sooner rather than later. But it’s an obvious interesting side note.
These issues considered, a cautious bearish policy and exposure are advised for shorter-term traders with a recovery above 134.195 required to negate this specific count and warrant its cover. A bullish policy and exposure remain advised for longer-term institutional players with a failure below 133.095 required to pare exposure to more conservative levels and commensurately larger-degree weakness below 132.24 required to jettison remaining exposure and reverse into a new bearish policy.


