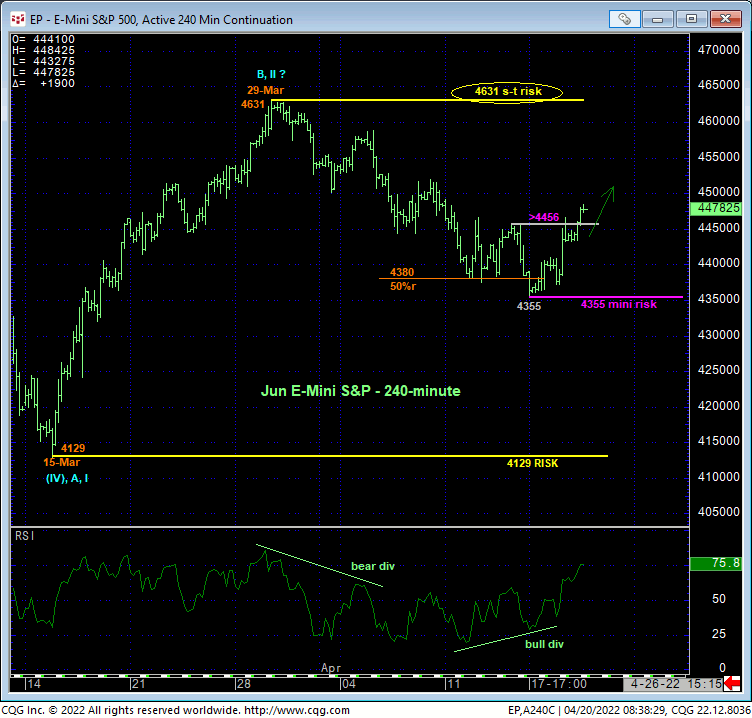
In yesterday morning’s Technical Blog we cited last Thur’s 4456 minor corrective high as the level the market needed to sustain losses below to maintain a more immediate bearish count. The market’s subsequent failure to do so confirms a bullish divergence in short-term momentum that defines Mon’s 4355 low as the END of the decline from 29-Mar’s 4631 high, exposing at least a steeper correction of this decline and possibly a resumption of mid-to-late-Mar’s uptrend to new highs above 4631. Per such, Mon’s 4355 low serves as a tight but objective risk parameter from which non-bearish decisions like short-covers and cautious bullish punts can be objectively based and managed.

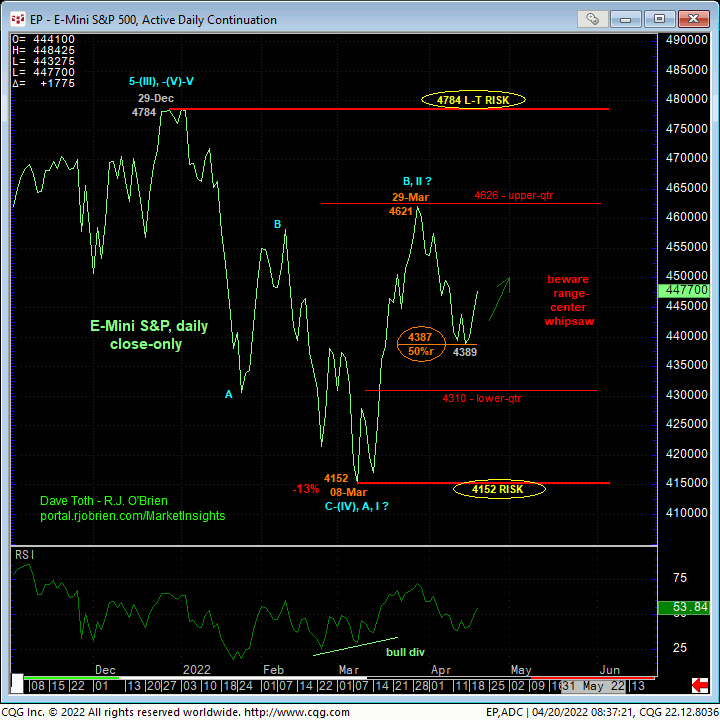
This very conservative/tight but objective risk parameter at 4355 will come in handy and is indeed warranted from deep within the middle-half bowels of this year’s range where the odds of aimless whipsaw risk are approached as high and the risk/reward merits of directional exposure are abhorrent. Under these conditions, a more conservative risk parameter exactly like 4355 is required.
The daily close-only chart below also shows last Thur’s resulting 4389 low close being just two points away from the (4387) 50% retrace of Mar’s 4152 – 4621 rally that would seem to reinforce at least an interim, intra-range base/correction/reversal higher and emphasize recent lows- 4389 on a closing basis and 4355 on an intra0-day basis- as tight but objective levels from which the risk of cautious bullish punts can be objectively based and managed.

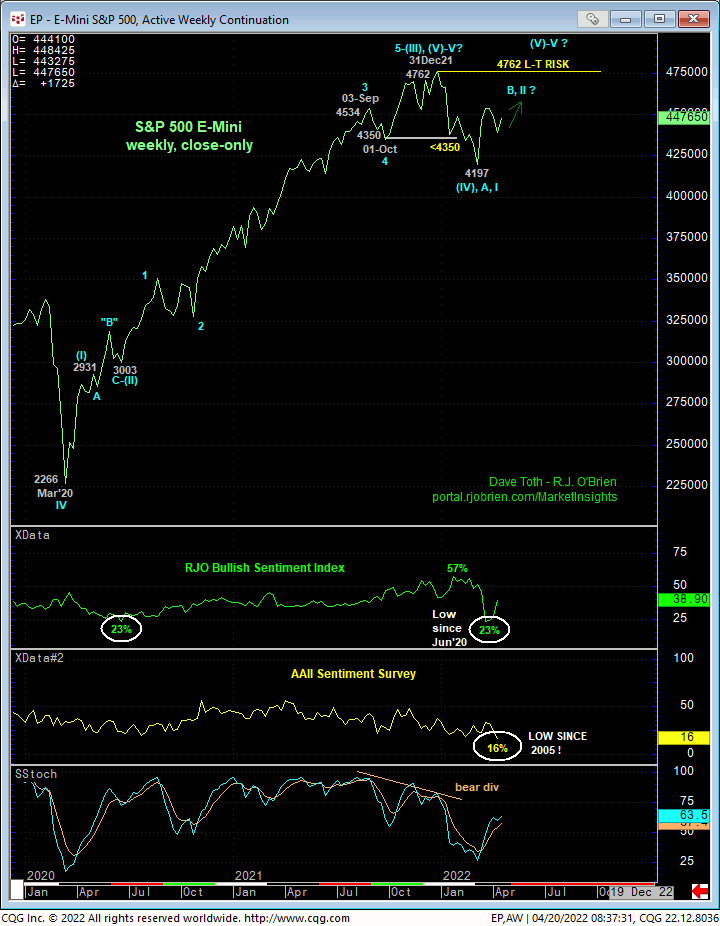
On an even longer-term basis shown in the weekly close-only chart below, the major peak/reversal elements introduced in Jan remain intact until nullified by a recovery above 31Dec21’s 4762 all-time high weekly close:
- a confirmed bearish divergence in MONTHLY momentum amidst
- historically frothy sentiment/contrary opinion levels and portfolio stock and stock-to-cash allocations, and
- an arguably complete and massive 5-wave Elliott sequence up from at least Mar20’s low (and possibly from 2009’s low).
Per this major peak/correction/reversal threat, the recovery from 11-Mar’s 4197 low weekly close is easily seen as a B- or 2nd-Wave corrective rebuttal to Dec-Mar’s A- or 1st-Wave decline within a major peak/reversal process. However, our RJO Bullish Sentiment Index pasted a late-Mar low of 23%, a level of pessimism in the Managed Money community not seen since Jun’20 before the secular bull took off. Additionally, the American Association of Individual Investors (AAII) Survey plunged last week to 16% DESPITE the market’s position only in the of this year’s range. This 16% reading is the lowest since 2005 and would be expected to be seen in an environment of collapsing prices, NOT in the middle of a lateral range. Both of these factors are arguably supportive of the market. Combined with a bullish divergence in short-term momentum discussed above that rejects/defines a specific low at 4355 from which the risk of a cautious bullish punt can be objectively based and managed, traders are advised to do so.
In sum, a cautious bullish policy and exposure on a scale-down from 4435-to-4420 is advised with a failure below 4355 required to not only negate this specific call and warrant its immediate cover, but also to reaffirm and resurrect the broader peak/correction/reversal threat that could produce protracted losses thereafter. In lieu of such sub-4355 weakness, further lateral-to-higher prices are anticipated in the period ahead that could include a retest of 29-Mar’s 4621 high close and the upper-quarter of this year’s range.


