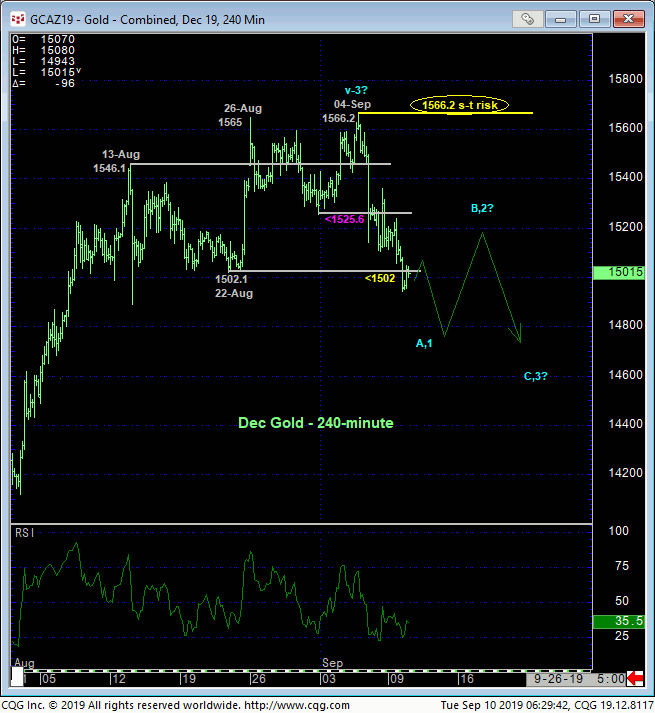
Starting with Thur’s micro mo failure below 30-Aug’s 1525.6 corrective low and then continuing with yesterday’s break below 22-Aug’s 1502.1 corrective low and our short-term risk parameter, it’s easy to see some developing weakness that identifies 04-Sep’s 1566.2 high as one of developing importance and our new short-term risk parameter from which non-bullish decisions like long-covers and cautious bearish punts can be objectively based and managed. While it’s one thing to pare or neutralize bullish exposure as a result of these momentum failures however, the very bullish factors behind the extent and impulsiveness of the past four months’ rally aren’t likely to evaporate into thin air that would warrant “chasing” initial counter-trend weakness lower. Rather, we suspect an eventual (B- or 2nd-Wave) corrective rebuttal to this initial sell-off attempt. Following another bearish divergence in short-term mo from some level shy of last week’s 1566 high needed to stem that rebound, a preferred risk/reward selling opportunity will be presented.


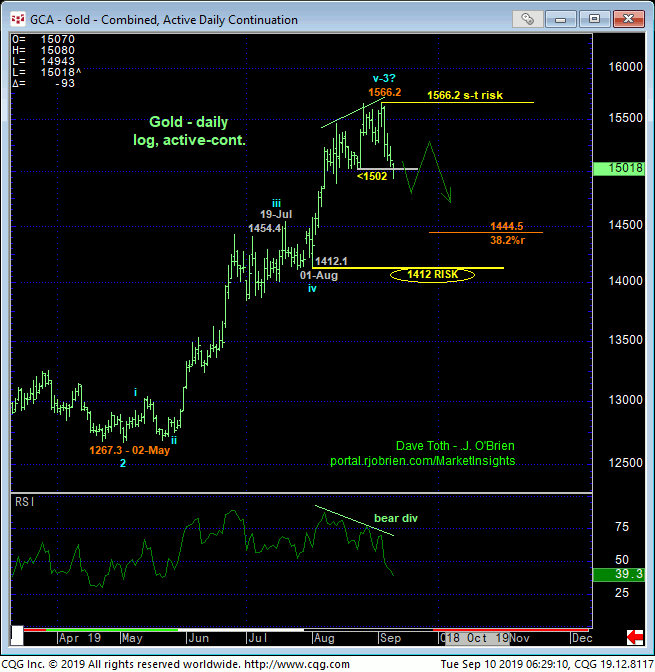
From a longer-term perspective, the extent of May-Sep’s (suspected 3rd-Wave) rally precludes us from concluding a broader peak/reversal environment at this juncture. While today’s break below 22-Aug’s 1502.1 low confirms a bearish divergence in momentum, this mo failure is of too minor a scale to conclude the end of the broader uptrend from 02-May’s 1267.3 low. Commensurately larger-degree weakness below at least former 1454-area resistance-turned-support from Jun-Jul and preferably below 01-Aug’s 1412 corrective low remains arguably required to break the 4-month uptrend.
As there’s a lot of green between the 1502 shorter-term failure point and that 1412 level, all but the longest-term players are advised to pare or neutralize exposure to circumvent the depths unknown of a correction or reversal lower as a couple other factors contribute to this peak/correction/reversal-threat environment.
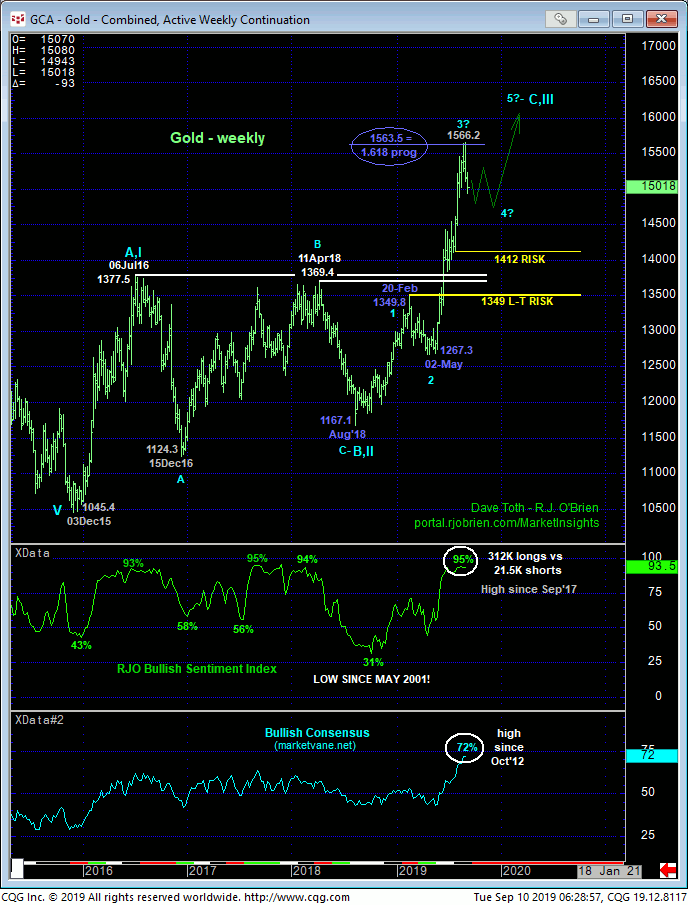
First, the weekly chart below shows that on a linear scale, the suspected 3rd-Wave rally from 02-May’s 1267.3 low came within a smidge of its (1563.5) 1.618 progression relationship to Aug’18 – Feb’19’s (suspected 1st-Wave) rally from 1167.1 to 1349.8. Secondly, our RJO Bullish Sentiment Index has recently ticked frothy levels (95%) not seen since Sep’17 while the Bullish Consensus (marketvane.net) is the highest (72%) since Oct 2012! While today’s bearish divergence in very short-term mo isn’t enough to conclude a broader peak/reversal count, against such frothy bullish sentiment/contrary opinion levels we believe this short-term mo failure cannot be ignored as an indication of at least interim corrective vulnerability of indeterminable scope that warrants a more conservative approach for bulls “up here”. Such an approach means a move to the sidelines by shorter-term traders and pared bullish exposure by longer-term players.

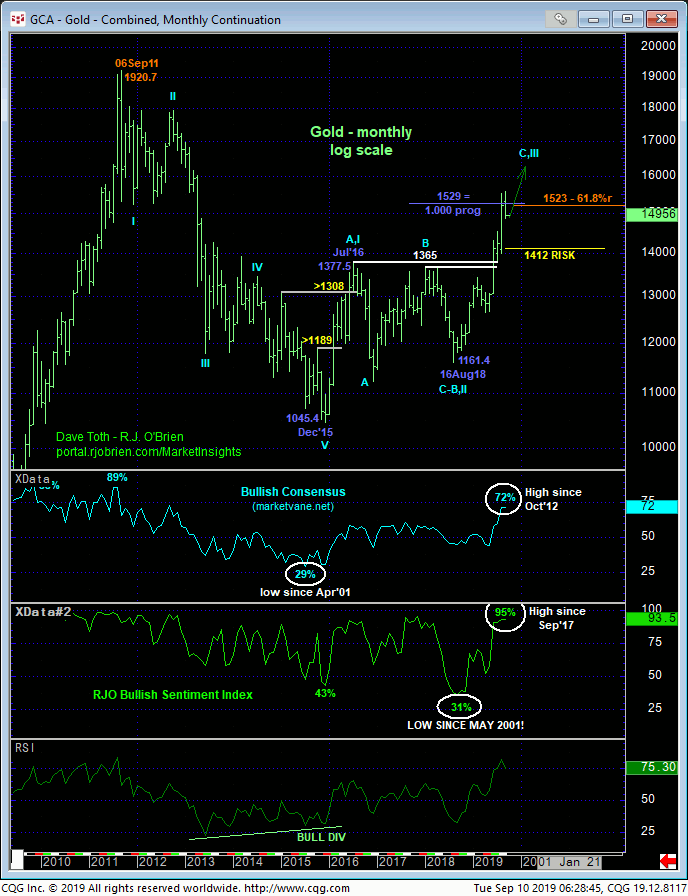
Finally, the monthly log chart below shows the past year’s continuation of our major base/correction/reversal count introduced in 08Feb2016’s Technical Blog as the market closed in on Oct’15’s 1189 corrective high it needed to recoup to confirm a bullish divergence in momentum of a scale sufficient to threaten the secular bear market from Sep’11’s 1920 all-time high. And while that B- or 2nd-Wave from Jul’16’s 1377 high to Aug’18’s 1161 low took forever, the market never broke below a level that negated this long-term bullish count.
Now the question is whether the near-4-year recovery has miles to go in a resumption of a multi-DECADE super bull to new highs above 1920 OR is the recovery from Dec’15’s 1045 low just a 3-wave correction of 2011 – 2015’s impulsive, 5-wave decline ahead of an eventual resumption of that initial counter-trend decline. TO THIS POINT the recovery from 1045 to this month’s 1566 high is clearly only a 3-wave affair. As discussed above, the past few days’ slip is obviously of too minor a scale to conclude anything more than another interim corrective hiccup. But given such frothy bullish sentiment currently and as long as 04-Sep’s 1566.2 high remains intact as a short-term risk parameter, traders are advised to acknowledge the prospect of a more protracted correction or reversal lower.
These issues considered, shorter-term traders with tighter risk profiles have been advised to move to a neutral/sideline position. They are also advised to keep a keen eye on a labored 3-wave corrective rebound to, say, the 1535-to-1545-area where a rebound stemming bearish divergence in mo will offer a preferred risk/reward selling opportunity. Long-term players are advised to pare bullish exposure to more conservative levels and jettison the remainder of the position on commensurately larger-degree weakness below 1412. We will also be watchful for a relapse stemming BULLISH divergence in short-term mo that would warn of at least a corrective retest of last week’s 1566.2 high and possibly a resumption of the secular uptrend.


