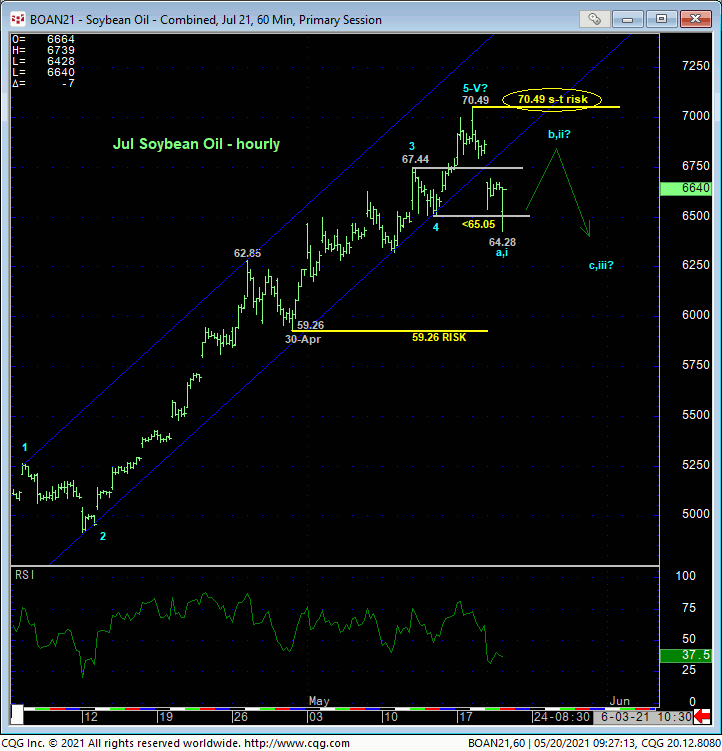
This morning’s slip below 13-May’s 65.05 low and short-term risk parameter discussed in yesterday’s Technical Webcast confirms a bearish divergence in momentum that’s obviously of too minor a scale to conclude anything more than another interim bull market correction at this juncture. But it is sufficient however to identify Tue’s 70.49 high as one of developing importance and a short-term risk parameter from which non-bullish decisions like long-covers and cautious bearish punts can be objectively based and managed. And at a time when most of the rest of the ag complex has lost at least some of its upside mojo due to similar and even larger-degree mo failures while soybean oil is trading at historical 70+ levels it has only seen temporarily in 2008 before melting down, it would not be a stretch at all to consider the admittedly short-term momentum divergence as an early warning of a peak/reversal-threat prospect that could be major in scope. To defer or diffuse this threat, all the bull’s gotta do is recoup 70.49.

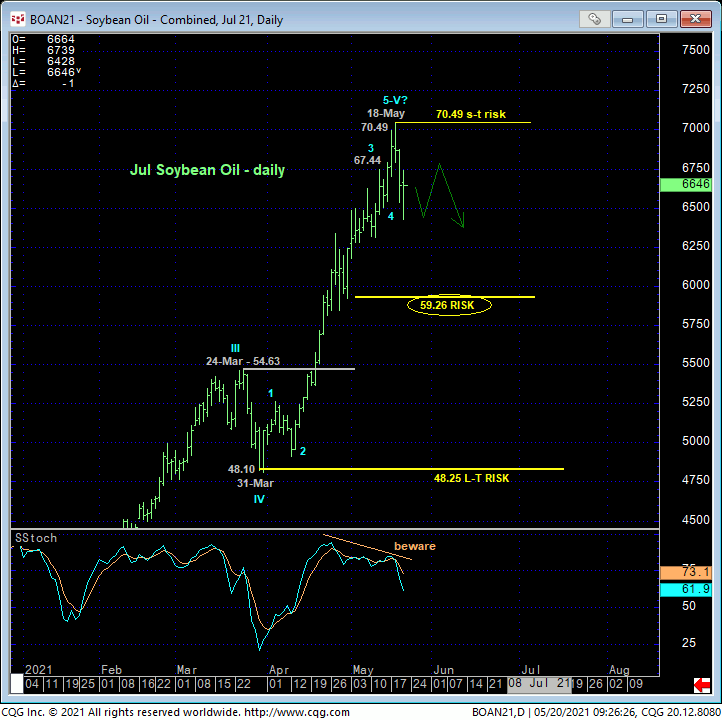
Stepping back, while the rally from 30-Mar’s 48.25 Globex day-session low to Tue’s 70.49 high looks to be a complete 5-wave Elliott structure as labeled, the magnitude of this rally precludes us from concluding a complete structure following such minor weakness as today’s below such a smaller-degree corrective low like 65.05. Indeed, given the backdrop of the mammoth secular bull trend from Apr’20’s 25.09 low, or even the latest portion of that bull from 30-Mar’s 48.25 low, we believe “more” peak/reversal behavior is required to bet on a larger-degree correction. “More” such behavior could come from either commensurately larger-degree weakness below 30-Apr’s 59.26 next larger-degree corrective low labeled in the hourly chart (above) and/or further “rounding-top” behavior like the market surviving a corrective retest of Tue’s 70.49 high and subsequent relapse below an initial counter-trend low like 64.28 currently.
On this latter point, IF the past couple days’ slip is the initial (A- or 1st-Wave) of a larger-degree correction or reversal lower, we would expect to see labored, corrective 3-wave behavior on the current recovery attempt that is stemmed by another bearish divergence in short-term mo from some level shy of 70.49. That would satisfy the third of our reversal requirements, albeit on a very small scale, and warn of further larger-degree correction or reversal below 64.28 that, given some long-term technical threats, could become protracted in scope. Needless to say, a recovery above 70.49 mitigates any peak/correction/reversal count, reinstates the secular bull and exposes potentially steep gains thereafter.


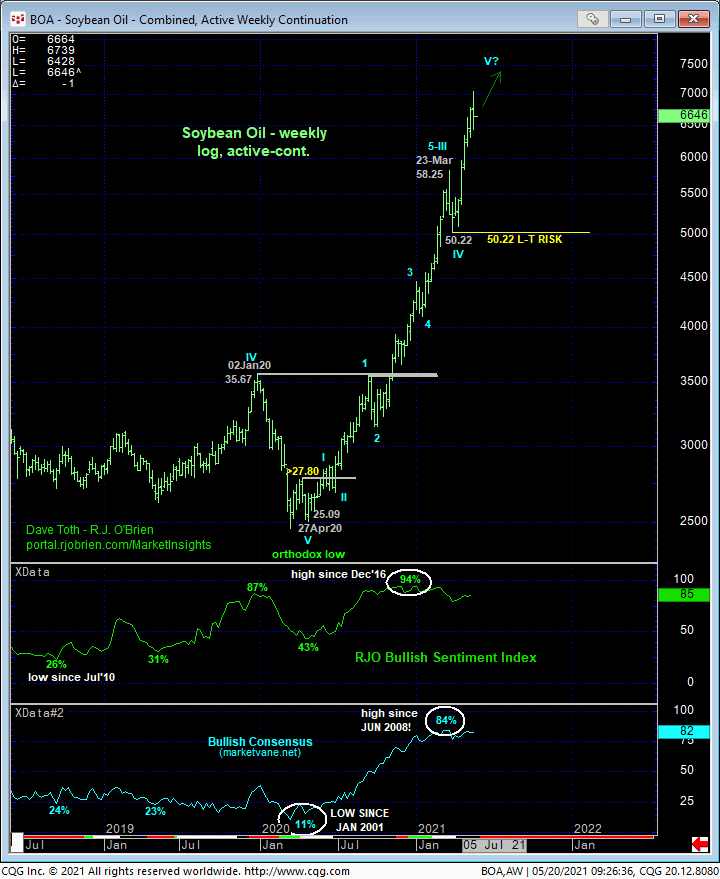
Developing longer-term peak/reversal threats include:
- waning upside momentum on both daily and weekly scales
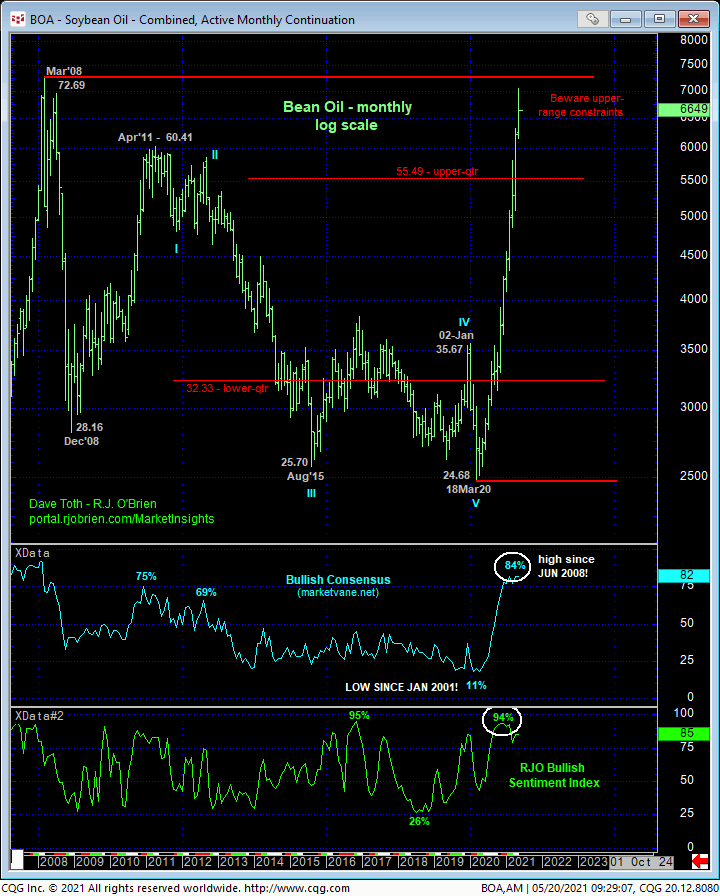
- historically frothy sentiment/contrary opinion levels not seen since at least 2016 and, in the case of the Bullish Consensus (marketvane.net), since 2008!
- an arguably complete or completing massive 5-wave Elliott sequence from last year’s 25.09 low as labeled above and
- the market’s close proximity to Mar 2008’s 72.69 all-time high shown in the monthly log chart below.
Now that former 2008 high at 72.69 is not considered resistance in the typical and applicable sense, but rather symbolic. Just being “up here” in general questions the risk/reward merits of maintaining a longer-term bullish policy. As we saw the past few weeks in canola, that market exploded through its 2008 previous all-time high of 769.9, spasmed up to a 863.2 high before failing miserably to sustain those gains. Technically, “up here”, it’s not about what heights the market takes out, but what corrective lows the bull sustains gains above. For if we’re supposed to remain long this market, especially way up here, it’s absolutely imperative that the bull continued to behave like a bull by sustaining its simple uptrend pattern of higher highs and higher lows. The consequences of its failure to do so, up here, amidst gargantuan bullish sentiment, waning momentum and an arguably complete wave count will be as monstrous and opportunistic as they were in 2008.
These issues considered, shorter-term traders have been advised to move to a neutral/sideline policy with a recovery above 70.49 required to negate this call and warrant returning to a cautious bullish stance. We will be watchful for proof of labored corrective behavior on a recovery attempt that stalls around the 68.10-area or higher for a preferred risk/reward selling opportunity. Longer-term players are advised to pare bullish exposure to more conservative levels and jettison remaining exposure on commensurately larger-degree weakness below 59.26.


