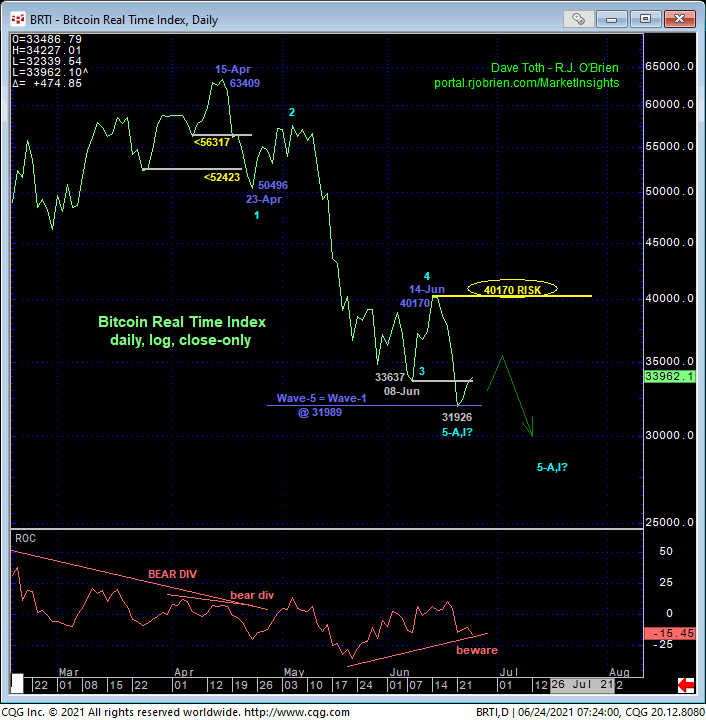
In Tue’s Technical Blog following the resumption of the major downtrend from 14-Apr’s 65520 high, we identified a minor corrective high at 33230 that this market needed to sustain losses below to maintain a more immediate bearish count for shorter-term traders with tighter risk profiles. The 240-min chart below shows the market’s recovery above this level yesterday that confirms a bullish divergence in short-term momentum. This smaller-degree momentum failure is obviously not of a scale to conclude the end of the 2-1/2-month collapse, but it IS enough to define Tue’s 28800 low as one of developing importance and a new short-term risk parameter from which non-bearish decisions like short-covers and cautious bullish punts can be objectively based and managed by shorter-term traders.


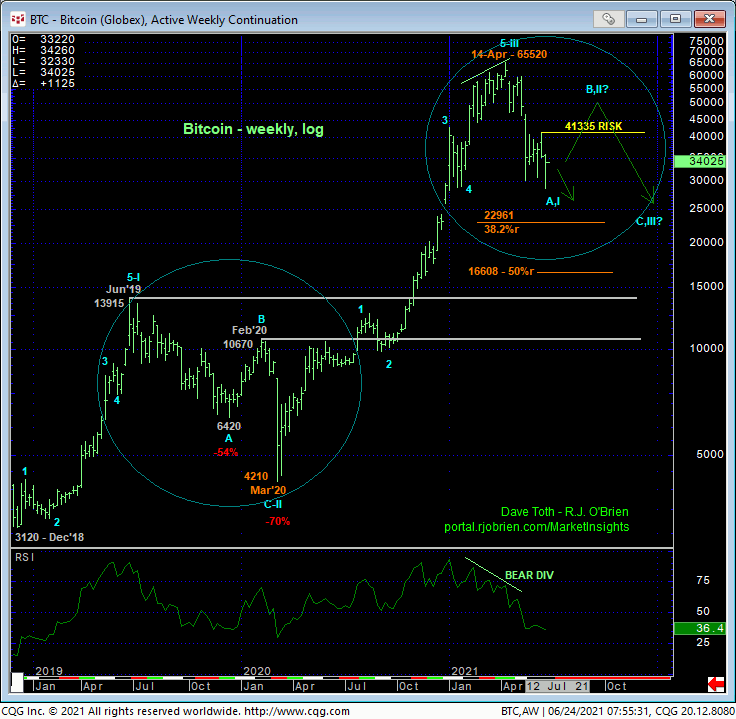
From a longer-term perspective, clearly, commensurately larger-degree strength above 15-Jun’s 41335 larger-degree corrective high and key long-term risk parameter remains required to, in fact, confirm a bullish divergence in DAILY momentum, break Apr-Jun’s downtrend and expose a major correction higher. Per such a bullish prospect, it is interesting to note what could be a textbook complete 5-wave Elliott sequence down from the Apr high. And looking at such a prospectively complete wave count in the underlying Bitcoin Real Time Index below, it could prove astonishing that the suspected 5th-Wave down from 14-Jun’s 40170 high came within a mere 63-pts of equaling (i.e. 1.000 progression) Apr’s 63409 – 50496 1st-Wave following an arguably “extended” 3rd-Wave down. This is a rather obscure Fibonacci relationship in Elliott theory, but a noted one nonetheless that could be complicit in an interim base/correction/reversal count that could see a relatively extensive multi-week or even multi-month (B- or 2nd-Wave) corrective rebound within an even more massive peak/reversal process.
Until the market proves commensurately larger-degree strength above mid-Jun’s respective highs however, and especially if the market relapses below Tue’s 28800 low, it would be premature to conclude a significant bottom at this juncture.
Finally and from an even longer-term perspective, the weekly log chart below puts Apr-Jun’s trendy, impulsive 5-wave decline in perspective to Mar’20 – Apr’21’s 4210 – 65520 rally. The extent and impulsiveness of the recent swoon, we believe, is just the initial A- or 1st-Wave of a major correction or reversal of the entire 2020 – 2021 rally that, until negated by a recovery above Apr’s 65520 high, should not surprise by multi-quarter price action that followed Jun’19’s 13915 high. Following an initial (A-Wave) decline from Jun’19’s 13915 high to Dec’19’s 6420 low that is virtually the same percentage loss as the past two months (54% vs 56%), the market corrected higher for two months to Feb’20’s 10670 high before succumbing to a completing and major C-Wave plunge from 10670 to Mar’20’s 4210 low and an ultimate correction of 70% of this market’s value.
If this current market can prove commensurately larger-degree strength above 41335, great, at least temporarily, a (suspected B- or 2nd-Wave) correction could retrace 50% to 61.8% or more (43439 to 47864 or more) noted in the daily log scale chart of the contract above. But if the market rolls over again from “anywhere up there”, the subsequent resumption of the correction or reversal lower could be quite opportunistic for bears ahead of resumed steep losses below 28800 and potentially to the 20,000-area or lower.
These issues considered, shorter-term traders have been advised to neutralize bearish exposure and are further advised to consider a cautious bullish punt from current 33995-area prices with a failure below 28800 required to negate this call, warrant its immediate cover and reinstates the major bear. Longer-term institutional players are advised to pare bearish exposure to more conservative levels and required commensurately larger-degree strength above 41335 to nullify a bearish policy and warrant a move to the sidelines. In effect, we believe this market has defined 41335 and 28800 as the key directional triggers heading forward.