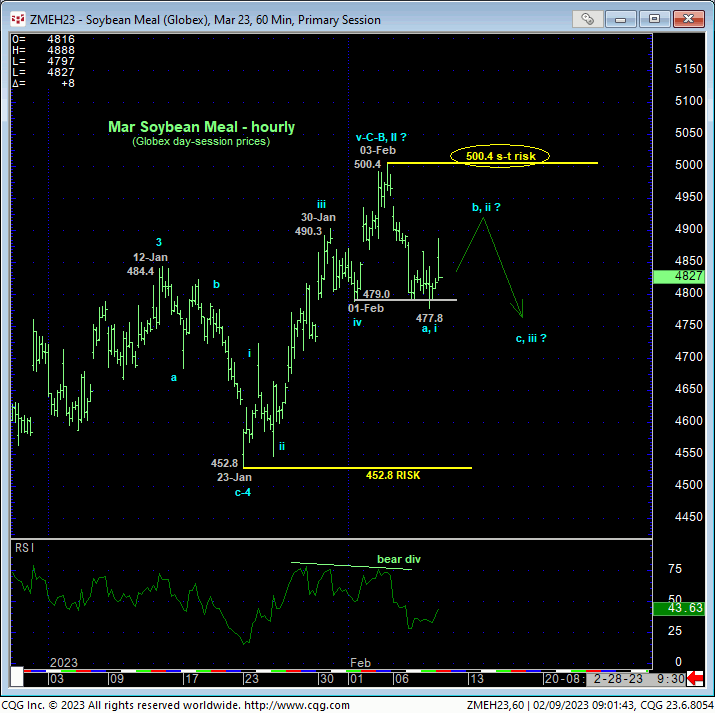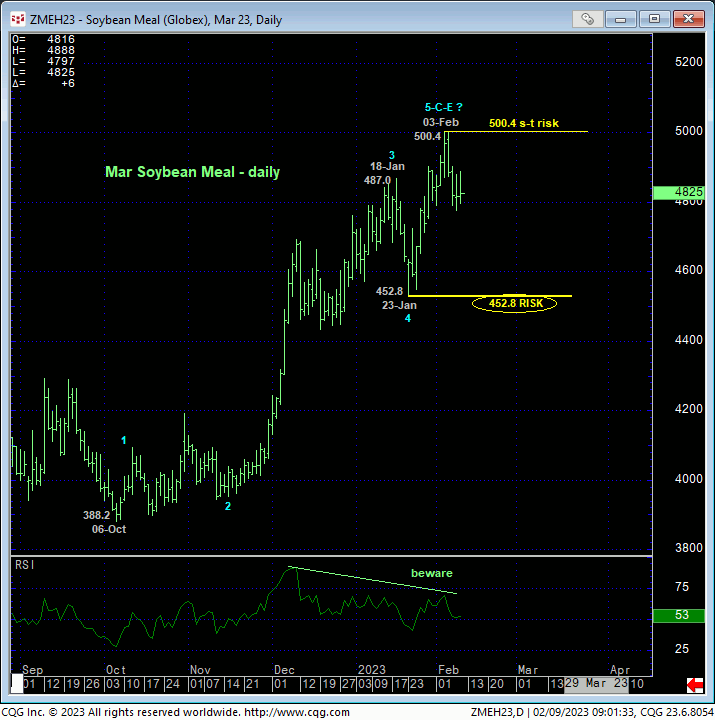
The market’s slip yesterday below 01-Feb’s 479.0 smaller-degree corrective low and short-term risk parameter discussed in 02-Feb’s Technical Blog confirms a bearish divergence in short-term momentum. This mo failure defines 03-Feb’s 500.4 high as the END of the portion of the secular bull trend from 23-Jan’s 452.8 larger-degree corrective low and our new short-term parameter from which shorter-term traders with tighter risk profiles can objectively base non-bullish decisions like long-covers and cautious bearish punts.


As always, we cannot conclude a larger-degree peak/reversal count from proof of only short-term weakness like yesterday’s failure below 479.0. However, every long-term momentum failure starts with exactly the type of short-term momentum failure we saw yesterday. The trick (well, it’s no trick at all, but rather a discipline) to navigating this discrepancy is acknowledging and incorporating technical and trading SCALE into your decision-making process. The fact of the current technical matter is that the short-term trend is down within the longer-term trend that remains arguably up. A recovery above 500.4 is required to negate/reverse the short-term downtrend while commensurately larger-degree weakness below 23-Jan’s 452.8 larger-degree corrective low and key long-term bull risk parameter remains required to break the major bull trend.
Given the backdrop of the secular bull trend, it is easy to see and accept the requirement that a break below 23-Jan’s 452.8 larger-degree corrective low is MINIMALLY required to break even the portion of the secular bull trend from 06-Oct’s 388.2 low, let alone the nearly-three-year bull from May’20’s 281.5 low. What is very interesting about yesterday’s admittedly short-term mo failure however are ancillary elements that must be recognized as threats to the secular bull. These elements include:
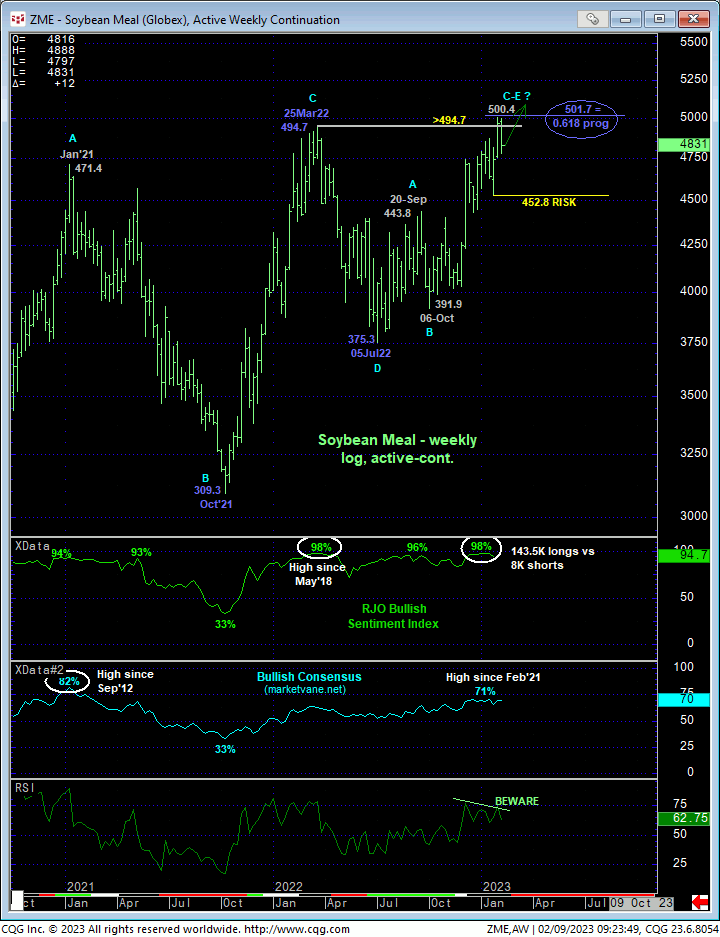
- waning upside momentum on a WEEKLY basis below amidst
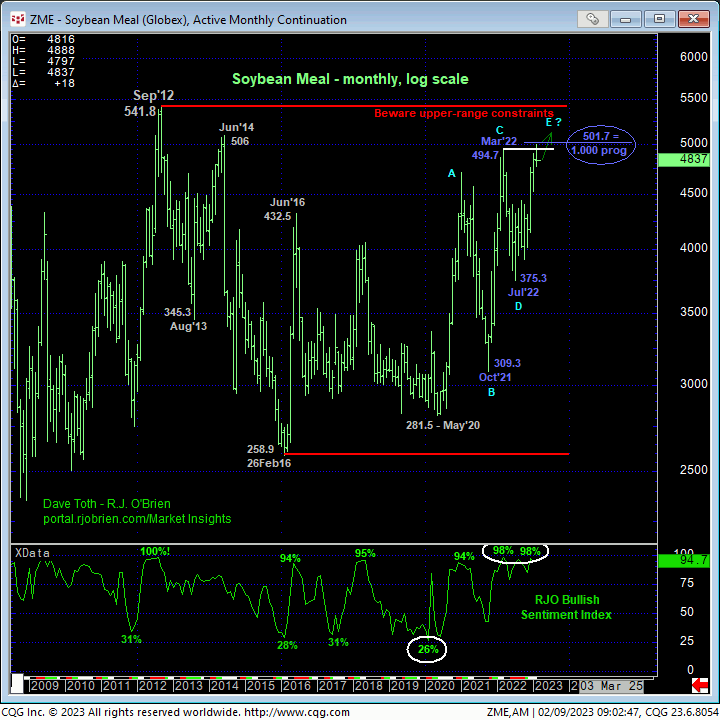
- understandably and historically stratospheric levels in market sentiment/contrary opinion
- the Fibonacci fact that last week’s 500.4 high came within a mere buck-and-a-half of the (501.7) 0.618 progression of Oct’21 – Mar’22’s 309 – 494 preceding rally from Jul’22’s 375 low, and…

- the market’s proximity to the extreme upper recesses of its massive but lateral historical range shown in the monthly log active-continuation chart below.
This is a unique and compelling list of technical facts that easily questions the risk/reward merits of a longer-term bullish policy UP HERE.
No, we cannot conclude a major peak/reversal count from yesterday’s bearish divergence in short-term momentum. All we can conclude from this mo failure is 03-Feb’s 500.4 high as a reliable high and resistance from which non-bullish decisions like long-covers and cautious bearish punts can be objectively based and managed. A recovery above 500.4 reinstates the major bull ahead of indeterminable gains thereafter. And it’s also acknowledged that commensurately larger-degree weakness below 23-Jan’s 452.8 larger-degree corrective low remains required to confirm larger-degree weakness and vulnerability that, given the technical facts listed above, we believe will expose a major peak/reversal environment that will rival those stemming from 2012 and 2014’s highs. What the market has in store for us between 500.4 and 452.8 is anyone’s guess at this juncture. BUT IF this market is in the early stages of a major top, we would expect to see proof of labored, 3-wave corrective behavior on recovery attempts that fall shy of 500.4 and trendy, impulsive behavior on sell-offs.
These issues considered, shorter-term traders have been advised to move to a neutral/sideline position as a result of yesterday’s failure below 479.0. We will also be watchful for proof of 3-wave corrective behavior on a pop to the 489-to-492-area and another bearish divergence in short-term mo for a risk/reward selling opportunity that we believe could be outstanding. Longer-term commercial players are advised to pare bullish exposure to more conservative levels and jettison remaining exposure on a failure below 452.8. Longer-term players also have the option of neutralizing bullish exposure at current levels and acknowledging and accepting whipsaw above 500.4 in exchange for much deeper nominal risk below 452.8.


