Posted on Jan 06, 2023, 07:04 by Dave Toth
The market’s failure this week to sustain late-Dec losses below a very minor corrective high at 134.42 from 29-Dec confirms a bullish divergence in short-term momentum. The 240-min chart below also shows subsequent gains above Tue’s 134.54 initial counter-trend high leaves a smaller-degree corrective low in its wake at 133.79. Against the backdrop of even Dec’s portion of the secular bear trend from 142.91, this week’s recovery falls within the bounds of another mere correction within the still-unfolding major bear. But as a result of this week’s recovery and for some very compelling longer-term issues we’ll discuss below, a relapse below at least 133.79, if not 02-Jan’s 132.60 low should now be required to confirm this bearish count on a scale pertinent to shorter-term traders with tighter risk profiles. In lieu of such, traders are advised to consider 133.79 as our new short-term risk parameter from which non-bearish decisions like short-covers and cautious bullish punts can now be objectively based and managed.
This correction-vs-reversal challenge stems from being unable at this juncture to determine if the decline from 07-Dec’s 142.91 high to Tue’s 132.60 low completed only 3-waves or if it’s a complete 5-wave sequence. As 13-Dec’s 139.77 low is the obvious 1st-Wave low of this sequence, this week’s prospective 4th-Wave correction cannot cross above 139.77. If it does, this will not only confirm Dec’s decline as a complete 5-wave affair, it may also warn of a BASE/reversal threat that could be major in scope. This is why we still note 139.77 as our long-term bear risk parameter pertinent to longer-term institutional players. If this week’s pop is just another correction, we would expect a countering bearish divergence in short-term momentum from somewhere between spot and 139.77.


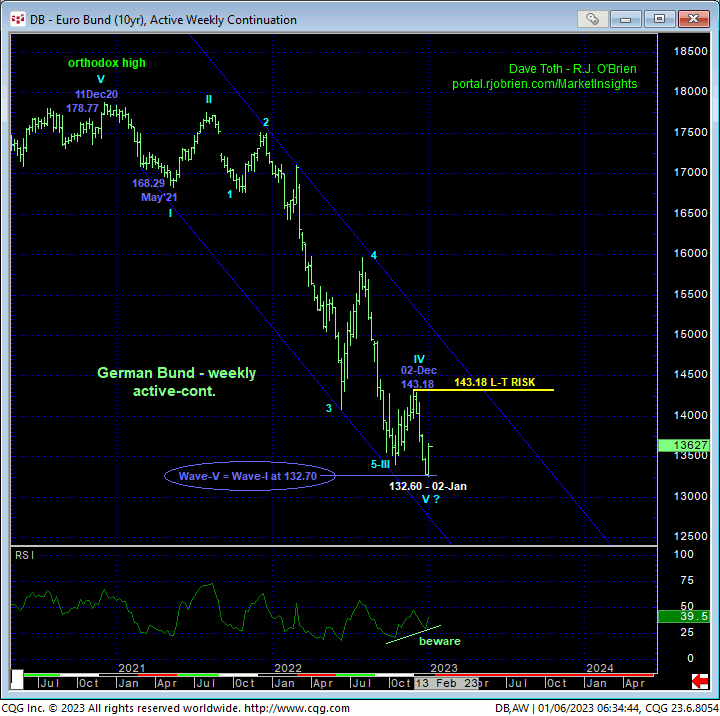
From a long-term perspective, there are three factors shown in the weekly active-continuation chart below that are compelling with respect to the prospect that the secular bear trend from Dec’20’s 178.77 high may have ended:
- the nicely developing POTENTIAL for a bullish divergence in momentum
- the prospect that the entire decline from 178.77 to 02-Jan’s 132.60 low is a textbook complete and massive 5-wave Elliott sequence, and
- the Fibonacci fact that the suspected 5th-Wave of this sequence down from 02-Dec’s 143.18 was only 10-ticks away from the (132.70) 1.000 progression of Dec’20 – May’21’s 1st-Wave decline from 178.77 to 168.29 since the massive 3rd-Wave down in the sequence obviously “extended”.
On this very long-term basis, commensurately larger-degree strength above 02-Dec’s 143.18 major corrective high is required to CONFIRM the bullish divergence in momentum and at least threaten the secular bear trend enough to warrant moving from a bearish stance to a neutral-to-cautiously bullish policy. It is obviously premature to conclude a major bottom from proof of only short-term strength thus far this week. But herein lies the importance of the flexion points and risk parameters we’ve identified above.
IF the market is in the early stages of a major reversal higher, it probably should not now fail below 133.79, it definitely must stay above 132.60 and it should produce trendy, impulsive behavior to the upside and break 139.77. Such a base/reversal count should also produce labored, 3-wave corrective behavior on setback attempts. A countering bearish divergence in short-term mo from a level shy of 139.77 and subsequent relapse below 133.79 will tilt the longer-term directional scales back to the bear side, with subsequent weakness below 132.60 reinstating the secular bear trend to depths unknown.
These issues considered, shorter-term traders with tighter risk profiles are advised to move to a neutral/sideline position in order to circumvent the heights unknown of a bigger correction or reversal higher. Current levels present poor risk/reward metrics from which to initiate directional exposure. Longer-term institutional players are advised to pare bearish exposure to more conservative levels and jettison remaining exposure on a recovery above 139.77.


