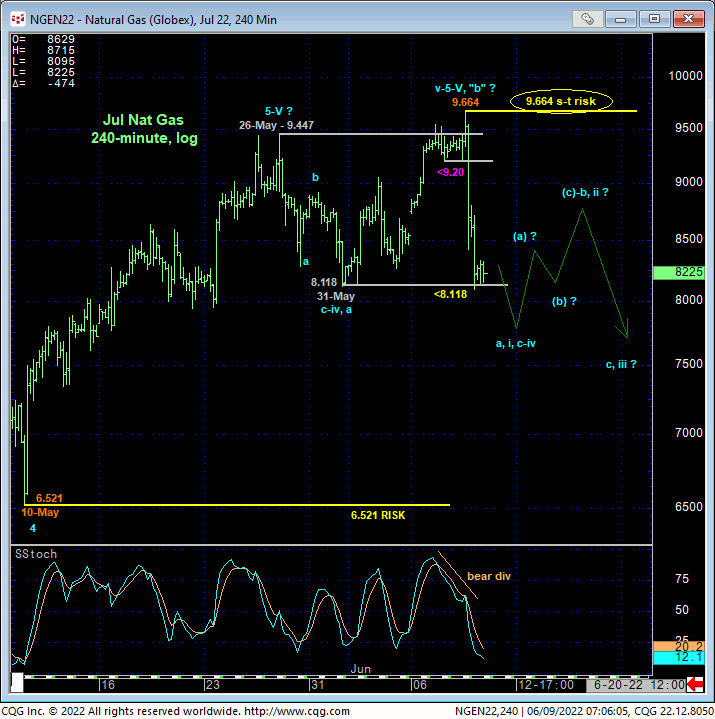
Yesterday and overnight’s surprise plunge confirms bearish divergences in momentum on two scales, but not one of a scale sufficient to conclude a major top. Starting with yesterday’s midday and minor slip below Tue’s 9.200 corrective low and then, most importantly, below 31-May’s 8.118 corrective low and our short-term risk parameter discussed in 02-Jun’s Technical Blog, the market has broken the uptrend from 10-May’s pivotal 6.521 larger-degree corrective low and key long-term bull risk parameter. Obviously, this defines yesterday’s 966.4 high as one of developing importance and a short-term risk parameter from which shorter-term traders with tighter risk profiles can objectively base non-bullish decisions like long-covers and new bearish punts.
Given the extent and impulsiveness of this relapse, we believe this decline is either the initial (A- or 1st-Wave) decline of a larger-degree correction or reversal lower or possibly the completing c-Wave of a bull market correction that actually stems from 26-May’s 9.447 high, with yesterday’s 9.664 high being the b-Wave “irregular” within this correction despite poking to a new high above 9.447. With the former bearish counts, we would expect any recovery attempts to unfold in a 3-wave corrective manner, arrested by another countering bearish divergence in momentum from some level south of 9.664 in the days/week or two ahead. If, alternatively, the latter bullish count is what the market has in mind, then the (5th-Wave) resumption of the secular bull trend would be expe3cted to unfold in a trendy, impulsive manner to new highs that is NOT countered by bearish divergence in momentum.
It is for exactly this reason and debate that the key third of our three reversal requirements exists: proof of 3-wave corrective behavior on a subsequent recovery attempt. The forces that have driven this major bull are unlikely to evaporate quickly into thin air, but rather over TIME. Indeed, major peak/reversal PROCESSES typically include an initial counter-trend (A- or 1st-wave) move south followed by an often-times extensive- in terms of both price and TIME- corrective (B- or 2nd-wave) rebuttal to the initial counter-trend decline. At best, this market has only satisfied the first two of our three key reversal requirements- a confirmed bearish divergence in momentum and proof of trendy, impulsive behavior down- and on only a short-term scale. To CONCLUDE a major top at this juncture would be grossly premature indeed. What we CAN conclude with specificity however is the market’s definition of yesterday’s 9.664 high as one of developing importance and, until recouped, a high that COULD be the end of this mega-bull given interesting ancillary elements discussed below.


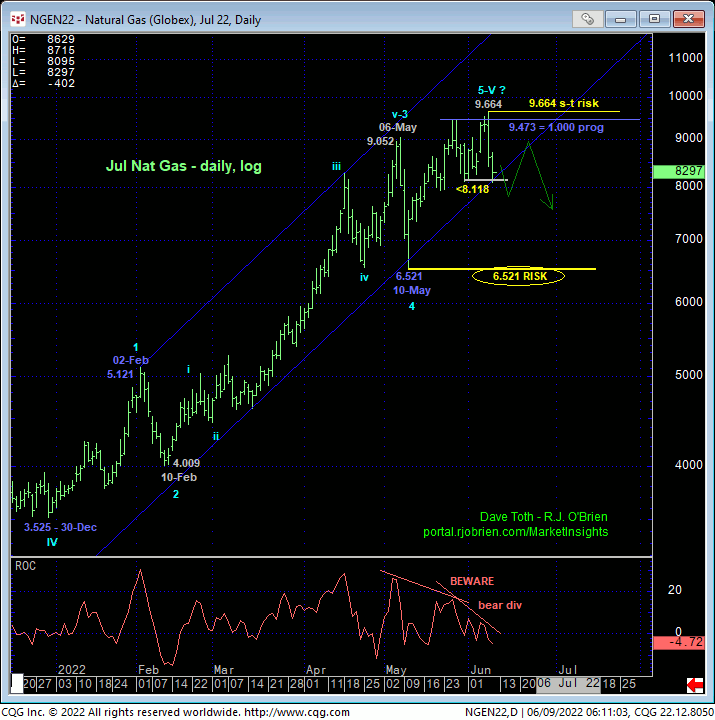
The daily log scale chart above shows the bearish divergence in daily momentum that breaks the uptrend from 10-May’s 6.521 larger-degree corrective low and key long-term bull risk parameter. To conclude a major top, commensurately larger-degree weakness below 6.521 remains required to, in absolute fact, break the major uptrend from at least 30Dec21’s 3.536 low. As always, we cannot conclude a major top from proof of only short-term weakness.
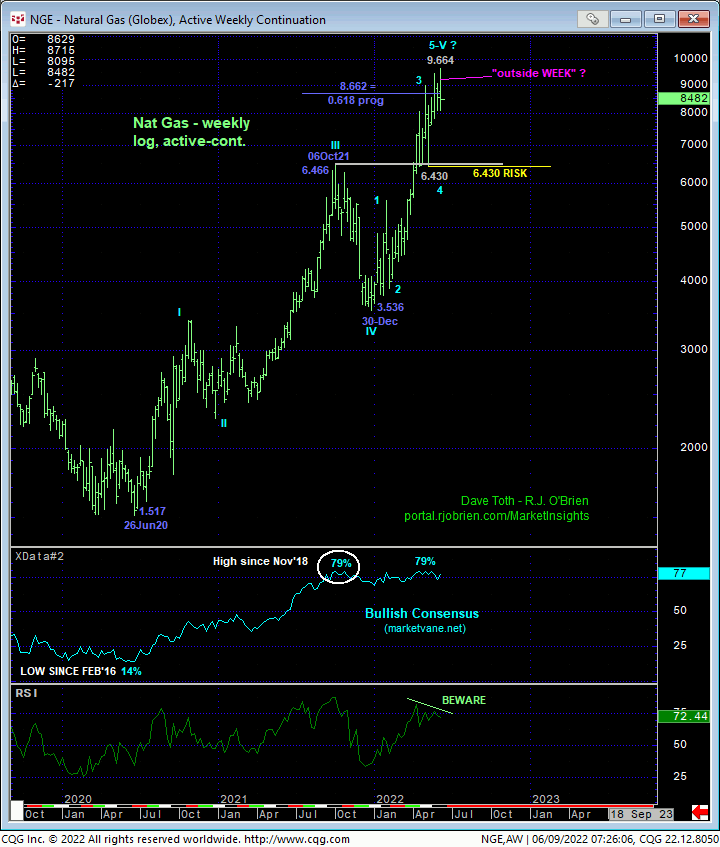
HOWEVER, today’s bearish divergence in relatively short-term momentum defines yesterday’s 9.664 high as arguably the end to a textbook 5-wave Elliott sequence from 30-Dec’s 3.525 low as labeled. And since the suspected 3rd-Wave of this sequence from 10-Feb’s 4.09 low to 06-May’s 9.052 high “extended”, the Fibonacci fact that the suspected 5th-Wave from 10-May’s 6.521 low came close to equally (i.e. 1.000 progression of) Dec-Feb’s 3.525 – 5.121 1st-Wave in length would seem to reinforce this count. Combined with historically frothy levels in the Bullish Consensus (marketvane.net) shown in the weekly log chart below amidst waning upside momentum on this broader weekly scale, it is not hard at all to envision the early stages of a developing peak/reversal threat that we believe would be massive in scope.
IF IF IF such a broader peak/reversal process is at hand, we should next expect proof of 3-wave corrective behavior on recovery attempts that could be extensive in the days and weeks ahead, first on an intra-day 240-min basis and then ultimately on a daily/weekly basis with a larger-degree failure below 10-May’s 6.521 low confirming the reversal. In effect, the market has defined 9.664 and 6.521 as the key directional flexion points heading forward. The MANNER in which this market trades lower and higher either trendy/impulsive or labored/corrective- with provide the evidence necessary to position for the next major move. Traders and even long-term commercial players are urged to move to a more flexible approach to this market that, until today, has been a one-way street higher.

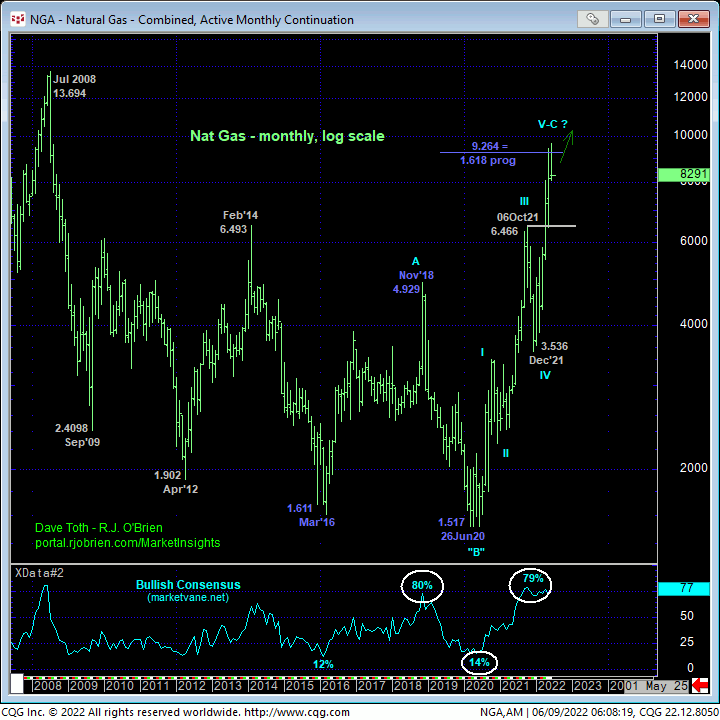
On an even longer-term basis, the prospective 5-wave rally from Dec’s 3.536 low on an active-continuation basis is arguably the completing 5th-Wave of a massive 5-wave sequence from Jun’20’s 1.517 low labeled in the weekly log chart above and monthly log chart below. And this entire rally came within a mere $0.40-cents of its (9.264) 1.618 progression of 2016 – 2018’s previous major rally from 1.611 to 4.929. Again, the piddly amount of weakness confirmed by overnight’s short-term momentum failure below 8.118 is grossly insufficient to conclude anything more than another interim corrective burp within the secular bull trend at this juncture. We would remind traders however that every larger-degree momentum failure below a level like 6.521 starts with exactly the type of short-term momentum failure the market confirmed today.
These issues considered, shorter-term traders have been advised to take profits on previous bullish exposure and move to a neutral/sideline position as a result of overnight’s bearish divergence in momentum. A bullish policy remains advised for long-term commercial players with a failure below 6.521 required to neutralize exposure. Longer-term players also have the option of paring or neutralizing bullish exposure now and acknowledging and accepting whipsaw risk, back above 9.664, in exchange for deeper nominal risk below 6.521. We will, of course, keep traders apprised of the interim requisite behavior in the critical weeks ahead that will either reinforce a continued bullish count or contribute to a peak/reversal count that we believe will provide an outstanding and long-term risk/reward opportunity from the bear side perhaps similar to that that followed Jul 2008’s spectacular top and collapse.


