Posted on Nov 08, 2022, 07:51 by Dave Toth
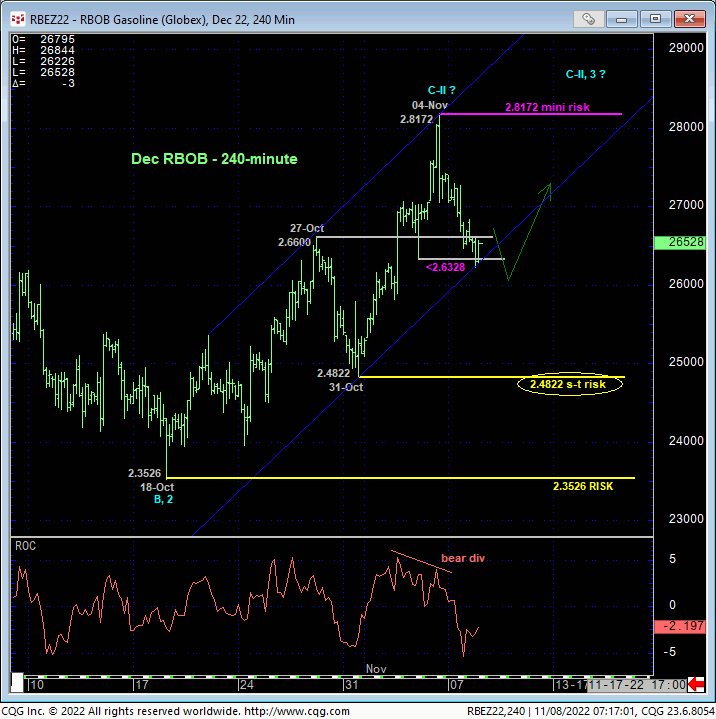
In Fri’s Technical Webcast we identified a minor corrective low at 2.6328 from Thur as a mini risk parameter the market needed to sustain gains above to maintain a more immediate bullish count. The 240-min chart below shows the market’s failure overnight below this level, confirming a bearish divergence in very short-term momentum. This mo failure defines Fri’s 2.8172 high as one of developing importance and a parameter from which very short-term traders can objectively base non-bullish decisions like long-covers.
Given the magnitude of the past three weeks’ broader recovery however, this short-term momentum failure is of an insufficient scale to conclude anything more than another correction within this broader recovery from 26-Sep’s 2.1877 low. Indeed, overnights failure below 2.6328 only allows us to conclude the end of the portion of the month-and-a-half rally from 31-Oct’s 2.4822 next larger-degree corrective low. 2.4822 is the risk parameter this market still needs to fail below to break the uptrend from 18-Oct’s 2.3526 low while this 2.3526 low remains intact as the risk parameter this market needs to fail below to break the month-and-a-half uptrend. From an intermediate-to-longer-term perspective, this week’s setback falls well within the bounds of another correction ahead of further gains. This is another excellent example of the importance of technical and trading SCALE and understanding and matching directional risk exposure to one’s personal risk profile.


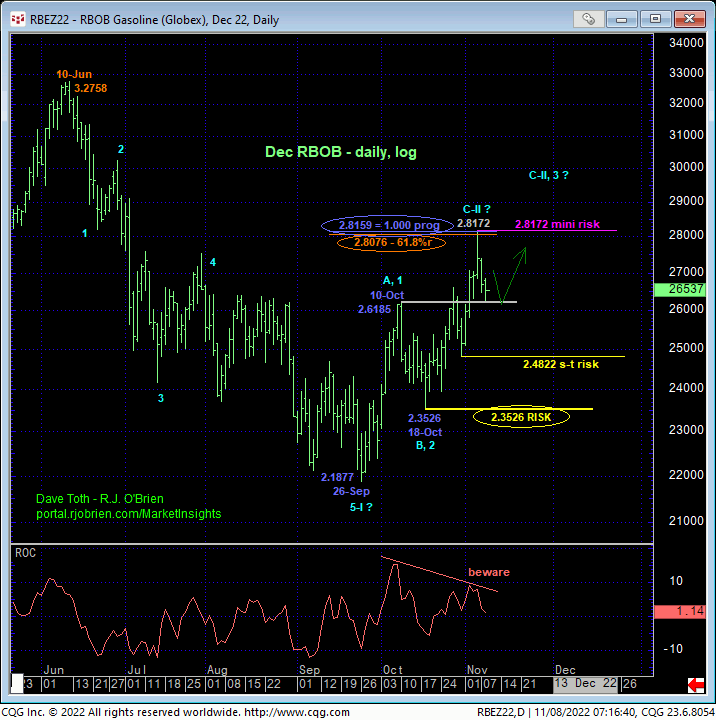
The reason overnight’s admittedly minor mo failure might have longer-term importance is the 2.8172-area from which it stemmed. In Fri’s Technical Blog we also noted the market’s engagement of the 2.8076-to-2.8159-area marked by the 61.8% retrace of Jun0-Sewp’s 3.2758 -2.1877 decline and the 1.000 progression of Sep-Oct’s initial 2.1877 – 2.6185 (suspected a-Wave) rally from 18-Oct’s 2.3526 (suspected b-Wave) low. We remind longer-term players that because of the unique and compelling confluence of:
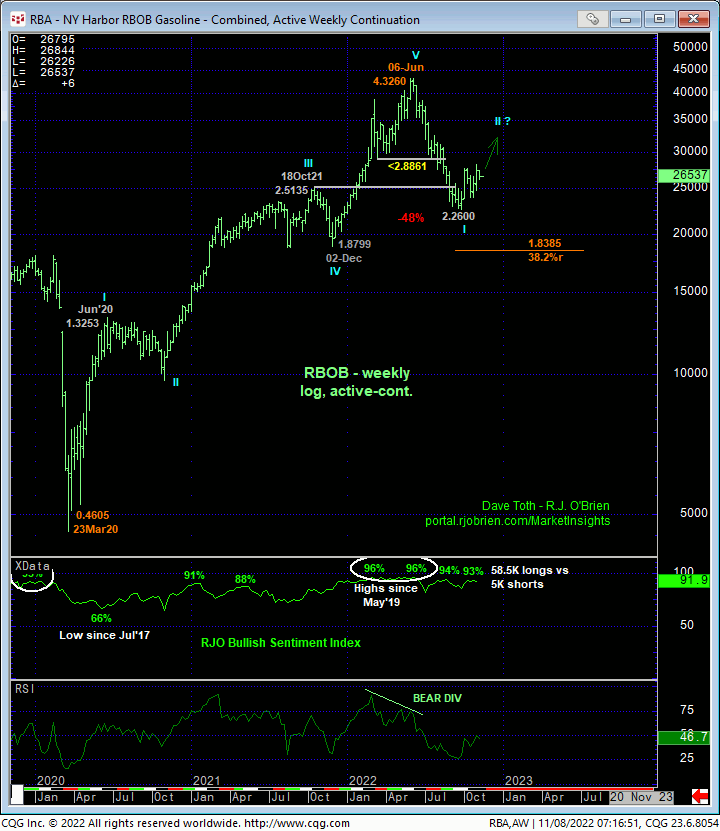
- early-Aug’s bearish divergence in WEEKLY momentum amidst
- historically extreme bullish sentiment/contrary opinion levels in our RJO Bullish Sentiment Index
- an arguably complete and massive 5-wave Elliott sequence from Mar’20’s 0.4605 low to Jun’s 4.3260 high (as labeled in the weekly log active-continuation chart below) and
- the 5-wave impulsive sub-division of Jun-Sep’s (suspected initial 1st-Wave) decline
The recovery attempt from 26-Sep’s 2.1877 low is arguably only a 3-wave (Wave-2) corrective rebuttal to Jun-Sep’s decline within a massive, multi-quarter PEAK/reversal process. Now granted, due to the magnitude of 2020 -2022’s secular bull market, we discussed the prospect for this (2nd-Wave corrective) recovery to be “extensive” in terms of both price and time. A “more extensive” correction is typified by a retracement of 61.8% or more and spanning weeks or even months following a 3-month decline. Per such, the (suspected corrective) recovery from 26-Sep’s 2.1877 low could easily have further to go, with commensurately larger-degree weakness than that exhibited this week (i.e., a failure below at least 2.4822) required to consider the correction complete. Indeed, the daily log chart above shows the market thus far respecting former 2.6185-area resistance from 10-Oct as a new support candidate.
These issues considered, very shorter-term traders have been advised to move to a neutral/sideline position following overnight’s momentum failure below 2.6328, with a recovery above 2.8172 required to negate this call, reaffirm the recovery and re-expose potentially significant gains thereafter. For intermediate- and longer-term players, a bullish policy and exposure remain advised with a failure below 2.4822 required to threaten this call enough to warrant neutralizing exposure. We will be watchful for another bearish divergence in momentum following a recovery attempt that falls short of Fri’s 2.8172 high that would be considered the next reinforcing factor to a count calling that 2.8172 high the prospective end to the month-and-a-half 2nd-Wave correction. In lieu of such, a resumption of the current rally to eventual new highs above 2.8172 should not surprise.


