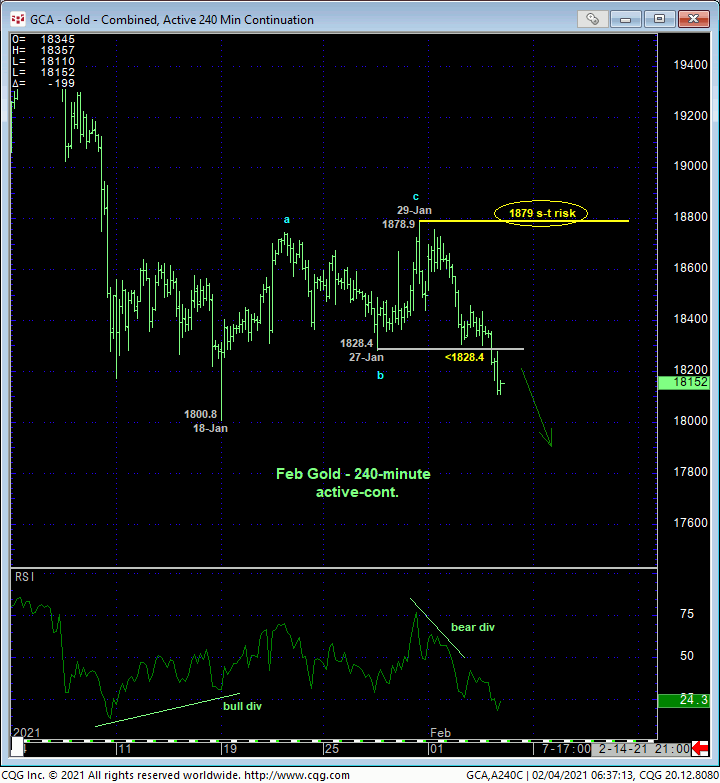
Overnight’s clear break below 27-Jan’s 1828.4 low and our short-term risk parameter negates our bullish count discussed in 29-Jan’s Technical Webcast, confirms mid-to-late-Jan’s recovery attempt as a 3-wave and thus corrective structure and re-exposes early-Jan’s downtrend that preceded it. The important by-product of this resumed weakness is the market’s definition of 29-Jan’s 1878.9 high as the latest smaller-degree corrective high and new short-term but key risk parameter this market is now required to recover above to resurrect an ultimately bullish count calling the price action down from last Aug’s 2089 all-time high a correction within the still-unfolding secular bull trend. Until and unless at least such 1879+ strength is proven, there’s no way to know at this point if the past six months’ erosion is a major correction that’s got further to go OR a major reversal lower.


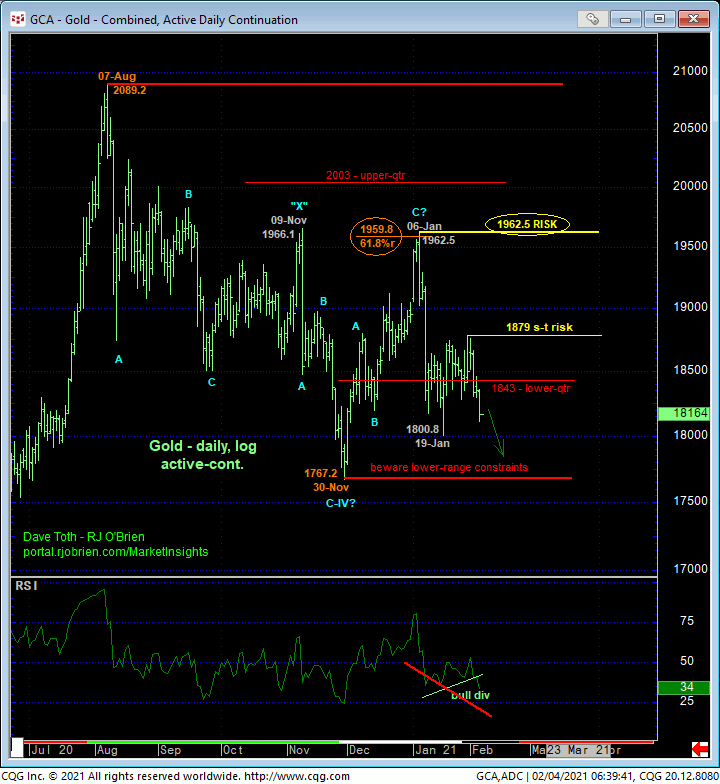
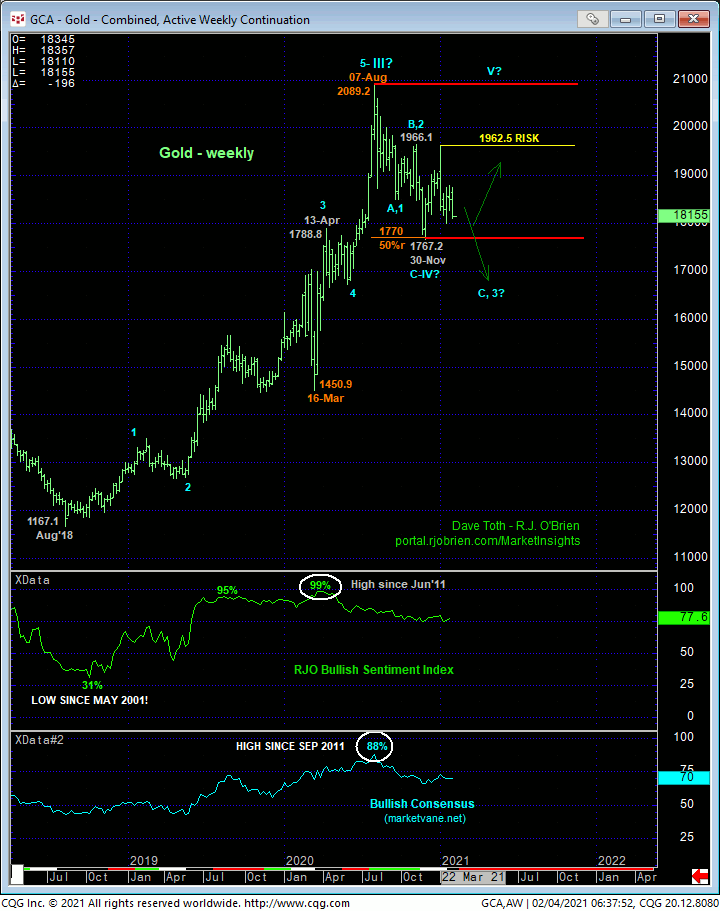
Since the market has yet to break late-Nov’s key low and support, it would be premature to give up on a longer-term bullish count that contends the thus-far labored, choppy price action down from 07-Aug’s 2089.2 high is a mere corrective/consolidative event that ultimate would be expected to yield t the secular bull trend. Indeed, the current lower-quarter of the six-month 2089 – 1767-range is an ideal time and place to keep a keen eye on any bullish divergence in momentum that would threaten a broader peak/reversal count and reinforce the bull market correction count. Herein lies the importance of admittedly smaller-degree corrective highs and short-term risk parameters like 1879. UNTIL such specific strength is shown however, the alternate bearish count must be acknowledged because of what could be steep, protracted losses below 30-Nov’s 1767.2 low.

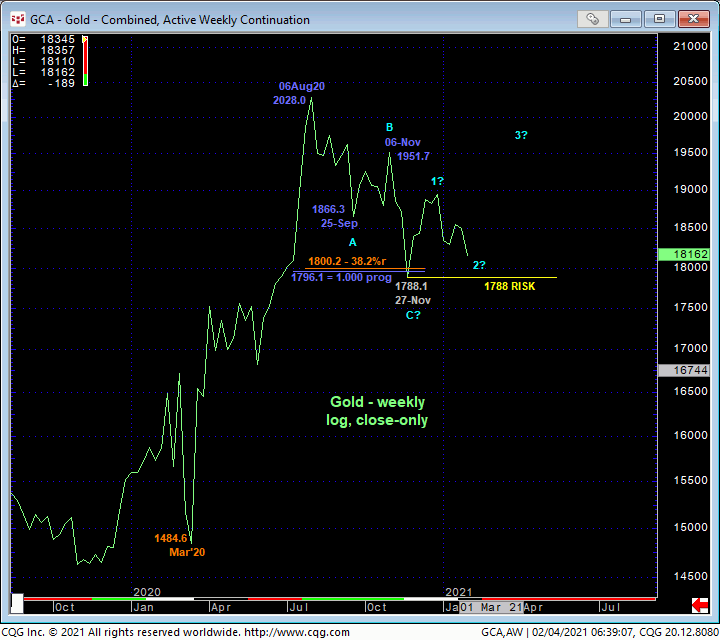
The weekly log close-only chart above shows Aug-Nov’20’s sell-off attempt thus far as clearly only a 3-wave affair that stalled in the immediate area of a pair of Fibonacci retracement and progression relationships. IF this relapse is indeed a correction, then those Nov lows have got to hold. If they’re broken, the market’s downside potential thereafter is indeterminable and potentially severe as there are NO reliable levels of any technical merit below them to consider as support.
These issues considered, a bullish policy has been negated, warranting the cover of all bullish exposure with a recovery above 1879 required to resurrect a bullish count. In lieu of such strength, and while acknowledging the lower-quarter of the six-month range as prospective support, further and possibly accelerated losses should not surprise. Per any broader bearish count, now-former 1830-to-1840-area support would be expected to hold as new resistance. “Down here”, it’s not hard to question the risk/reward merits of initiating bearish exposure as the minimum risk to 1879 seems steep for a “short-term” play. Per such, a neutral/sideline policy is advised for the time being. We will be watchful for a relapse-stemming bullish divergence in short-term mo “down here” for another favorable risk/reward opportunity from the bull side.


