Posted on Jun 12, 2023, 08:42 by Dave Toth
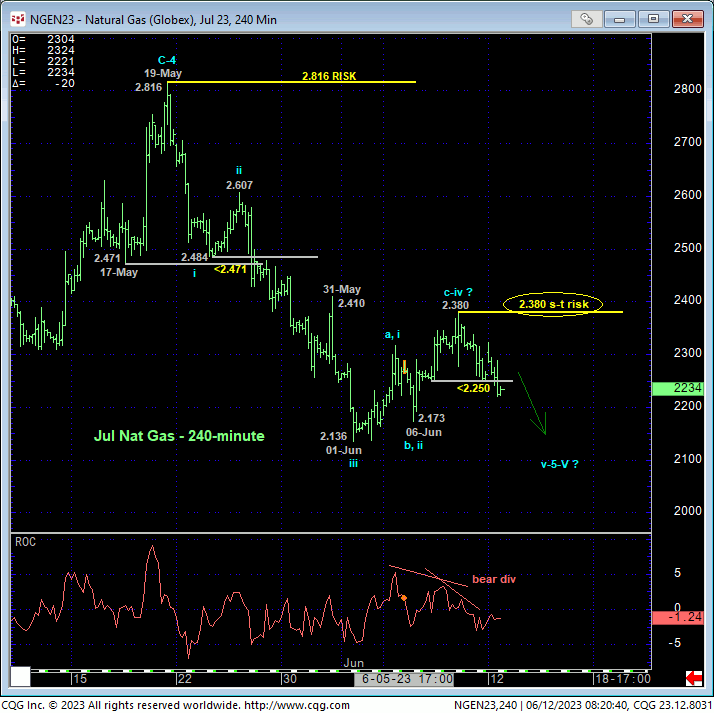
Overnight’s break below a very minor corrective low at 2.250 from last Wed confirms a bearish divergence in short-term momentum that breaks at least the portion of the recent recovery attempt from 06-Jun’s 2.173 low. Given the backdrop of the major bear trend however and what thus far is clearly only a 3-wave recovery attempt from 01-Jun’s 2.136 low as labeled in the 240-min chart below, Thur’s 2.380 may be considered the end or upper boundary of another correction within the major bear trend ahead of at least one more new lows below 01-Jun’s 2.136 low. Per such, we’re trailing our short-term bear risk parameter from 31-May’s 2.410 high discussed in 01-Jun’s Technical Blog to 2.380.


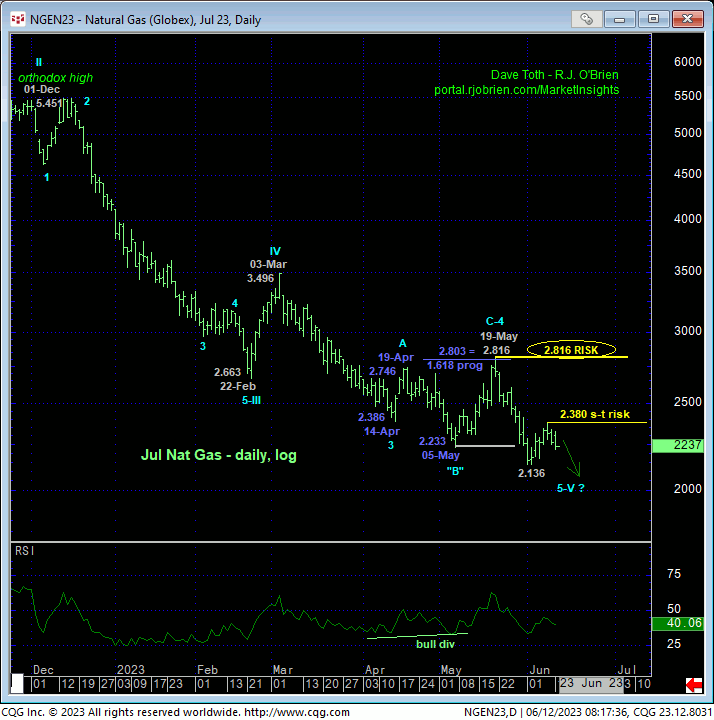
The daily log scale chart of the Jul contract above shows the dominance of the major bear trend where it’s easy to see the likelihood that the early-Jun bounce is just another correction ahead of a resumption of the major bear. To break the major downtrend from 01Dec22’s 5.451 orthodox high, commensurately larger-degree strength above 19-May’s 2.816 larger-degree corrective high remains minimally required for longer-term commercial players. Per such, this 2.816 level remains intact as our key long-term bear risk parameter.
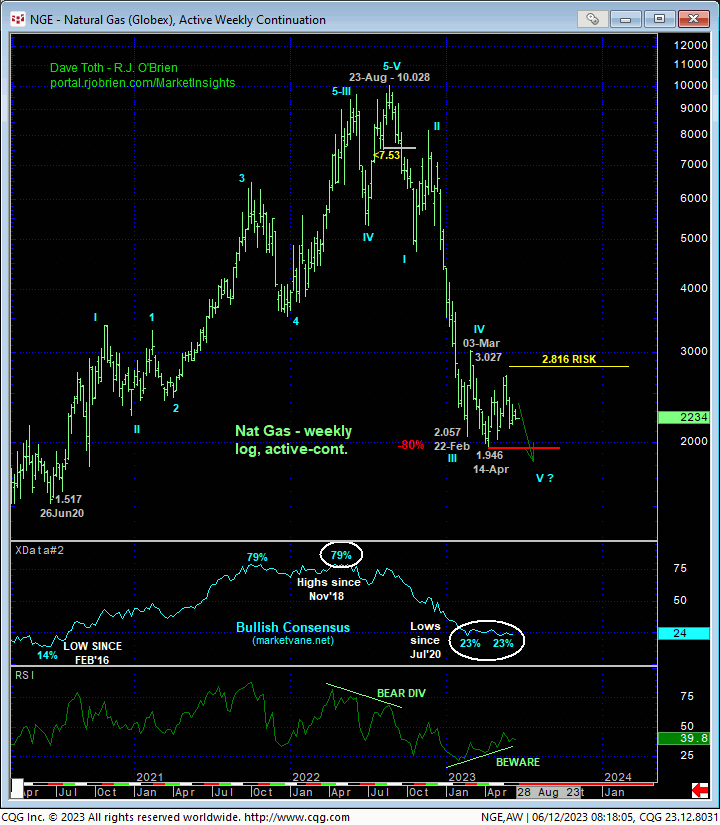
If the Jul contracts establishes a new low below 01-Jun’s 2.136 low, this still would not create a new low on an active-continuation basis as shown in the weekly log chart below. This is one of the vagaries of the futures markets. But such a continuation of the major bear trend from last Aug’s 10.028 high to new lows below 1.946 should hardly come as a surprise in what we believe are still the early stages of a major multi-month BASING process similar to that that unfolded between Mar and Jun of 2020 before the reversal took hold in Jul of that year. We’ve been discussing this process since early-Apr and we believe it remains ongoing and continues to warn of choppy, volatile and generally non-trending and challenging price action for months ahead. Per such, a more conservative approach to risk assumption is urged, and herein lies the importance of specific and tighter bear risk parameters like 2.816 and even 2.380.

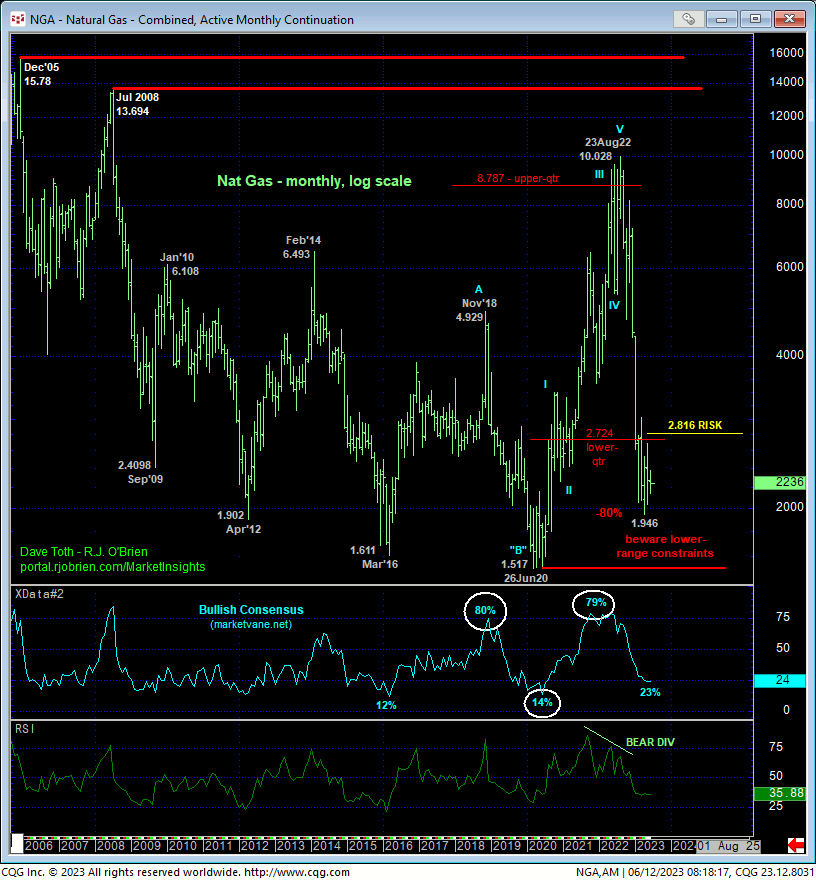
Stepping back even further, the monthly log active-continuation chart below shows the market’s return to the lower-quarter of its massive but lateral historical range that has repelled all four of the past assaults on sub-2.50 levels. IF IF IF the meltdown from last year’s 10.028 high is going to be similarly repelled “down here” like all the other base/reversals over the past 14 years, such will start with a rather obvious bullish divergence in MOMENTUM via a recovery above corrective highs like 2.816 and even 2.380. Until/unless such a divergence is confirmed, further lateral-to-lower prices remain expected.
These issues considered, a bearish policy and exposure remain advised with a recovery above 2.380 required for shorter-term traders to step aside and commensurately large-degree strength above 2.816 for longer-term commercial players to follow suit and then prepare for a major reversal threat. In lieu of such strength, further losses remain expected, including a run to new lows below not only 01-Jun’s 2.136 low in the Jul contract, but also mid-Apr’s 1.946 low in the then-prompt May contract.


