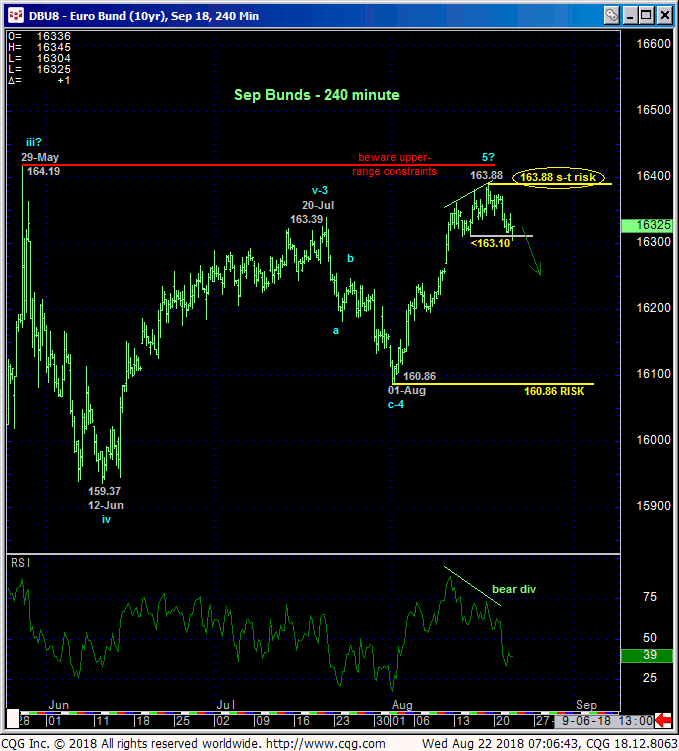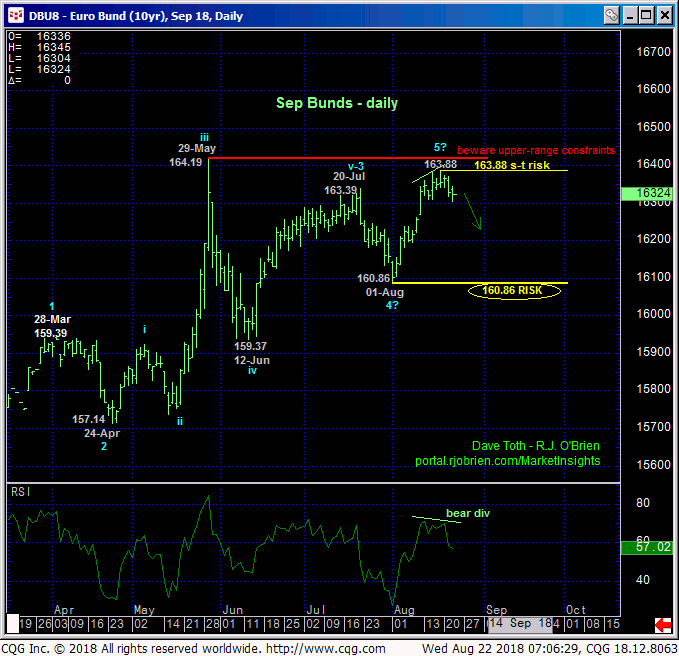
This morning’s failure below 15-Aug’s 163.10 corrective low and our short-term risk parameter discussed in Mon’s Technical Webcast confirms a bearish divergence in momentum that defines Fri’s 163.88 high as the end of the uptrend from 01-Aug’s 160.86 low. In this regard that 163.88 high becomes our new short-term risk parameter from which non-bullish decisions like long-covers and cautious bearish decisions can be objectively based and managed.
While this is an admittedly short-term mo failure from which it would be premature to conclude anything more than an interim corrective setback, ancillary reasons below warn that the market may be vulnerable to a more protracted decline.


One of those reasons is the market’s proximity to the 163.40-to-164.20-area that arguably defines the upper boundary of the past 2-1/2-month range shown in the daily chart above. Also, Aug’s component of this year’s rally could be the completing 5th-Wave of an Elliott sequence that dates from the early-Mar low. Commensurately larger-degree weakness below 01-Aug’s next larger-degree corrective low at 160.86 remains required however to conclude a larger-degree peak/reversal environment. For now we believe the market has identified 163.88 and 160.86 as the key directional triggers heading into the last third of the year.
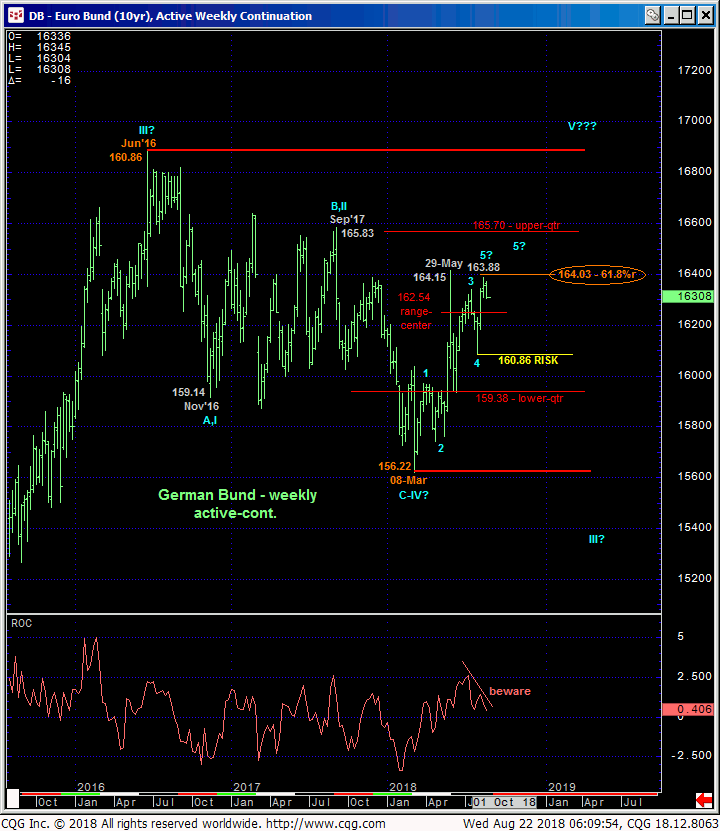
A couple other reasons to beware downside vulnerability is the market’s proximity to the (164.03) 61.8% retrace of 2016-18’s entire 160.86 – 156.22 decline and its position deep within the middle-half bowels of the two year range shown in the weekly chart below. We always approach the odds of aimless whipsaw risk from such range-center conditions as higher and that warrant a more conservative approach to risk assumption.
For shorter-term traders with tighter risk profiles, we believe the situation is clear as a result of this morning’s bearish divergence in short-term mo below 163.88 that warrants at least a move to the sidelines, if not a cautious bearish position until negated by a recovery above 163.88. For longer-term traders however, they’re posed with the challenge of maintaining a bullish policy because the longer-term trend is still up, but to have to risk that position until 160.86. From the middle-half of a 2-year range that could reek with aimless chop, that’s kind of a tough call. A compromise would be to pare bullish exposure to more conservative levels and exchange whipsaw risk (of having to buy this position back above 163.88) for larger nominal risk on a steeper decline.


