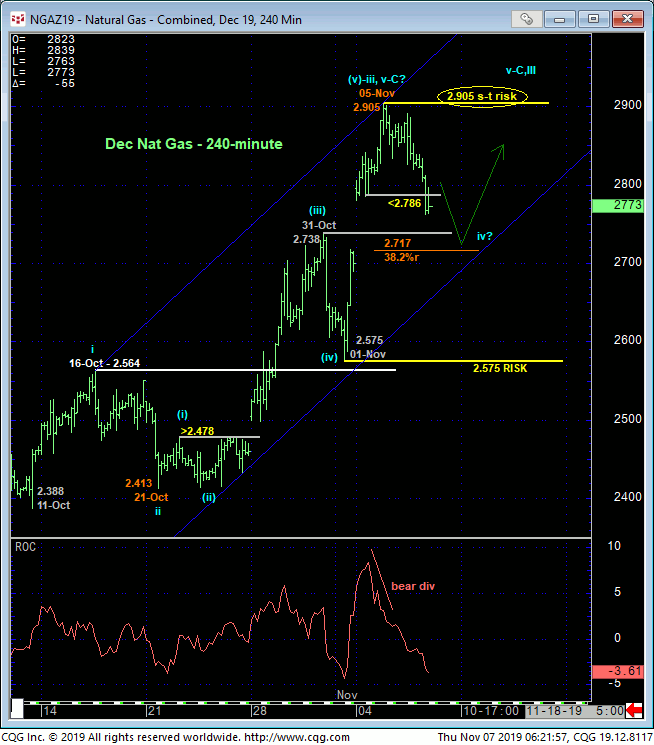
Overnight’s relapse below Mon’s 2.786 minor corrective low confirms a bearish divergence in short-term momentum. Shown in the 240-min chart below, this mo failure defines Tue’s 2.905 high as one of developing importance and our new short-term risk parameter from which non-bullish decisions like long-covers and cautious bearish punts can be objectively based and managed by shorter-term traders with tighter risk profiles.
This mo failure also exposes the prospect that the past couple week’s rally from 21-Oct’s 2.413 low is a complete 5-wave Elliott sequence as labeled below. But given the backdrop of a much broader base/reversal environment we’ll discuss below as well as the extent and impulsiveness of the rally from 11-Oct’s 2.388 low, yesterday and overnight’s setback thus far is of too small a scale to first be approached as anything more than an interim (4th-Wave) correction ahead of a resumption of the bull. And per such, we’ve identified 31-Oct’s 2.738-area of former resistance, the (2.717) 38.2% retrace of the rally fro,m 21-Oct’s 2.413 low to Tue’s 2.905 high and the lower recesses of the past month’s up-channel as a new support candidate to watchful for a relapse-countering bullish divergence in mo to arrest the setback and provide another favorable risk/reward condition from which to rebase a bullish policy.

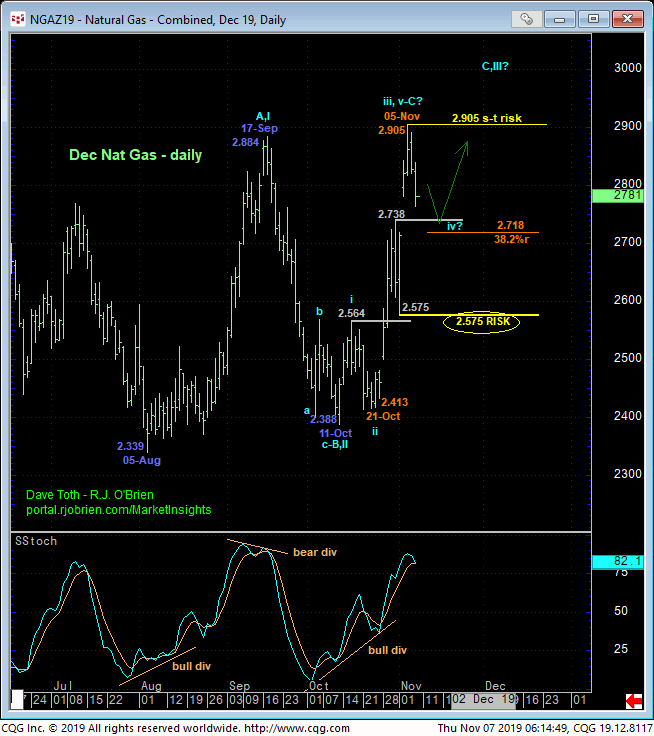
The daily chart below shows early-Nov’s break above 17-Sep’s 2.884 initial counter-trend high that confirms our major base/reversal count introduced in 29-Aug’s Technical Blog. 01-Nov’s 2.575 larger-degree corrective low remains intact as our key longer-term risk parameter this market is minimally required to fail below to jeopardize the impulsive integrity of a much broader base/reversal count. Setback attempts shy of this 2.575 threshold are advised to first be approached as corrective buying opportunities by longer-term players ahead of upside potential that we believe could prove relatively shocking in the months and perhaps even quarters ahead.


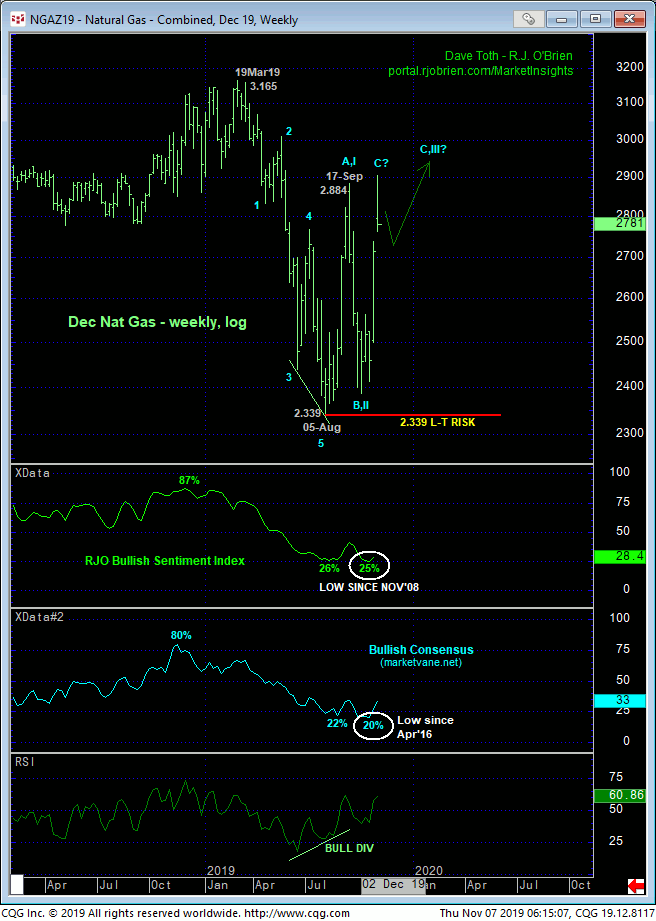
Our long-term base/reversal count remains predicated on the following technical facts:
- early-Sep’s bullish divergence in WEEKLY momentum that ended Mar-Aug’s downtrend and
- a complete 5-wave Elliott sequence from Mar’s 3.165 high to Aug’s 2.339 low in the Dec contract (4.929 to 2.029 in most active contract)
- historically bearish sentiment levels not seen in at least three years and, in the case of our RJO BSI, 11 YEARS!
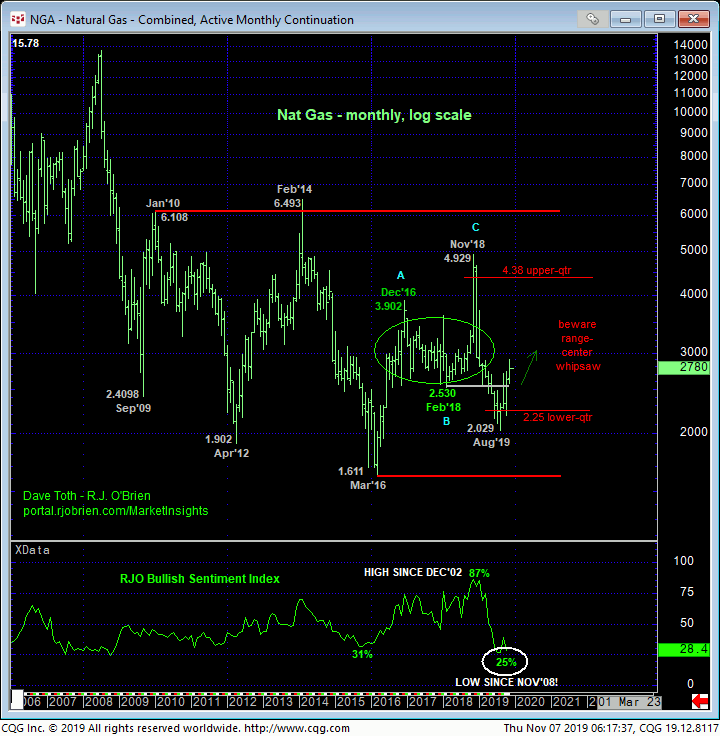
- rejection of the lower-quarter of the past 10 years’ range.
The past month’s resumption of Aug-Sep’s initial counter-trend rally reinforces this long-term base/reversal count and now puts the onus on the gear to proves weakness below at least our 2.575 risk parameter and preferably below Aug’s 2.029 low. Until and unless such weakness is shown, the facts we list above define the same type of base/reversal elements and conditions that stemmed from major lows in Mar’16, Apr’12 and Sep’09 from which the market mounted protracted, if intra-range recoveries of 206%, 241% and 153%, respectively. Until and unless the market defers or threatens this bullish count with weakness below the risk parameters specified above, we anticipate another such multi-month or eve multi-quarter reversal higher that could reach $4.00+ or even $5.00+ levels.
We also note in the monthly log chart below over two years of lateral price action between the 2.50 and 3.90-range that cannot be ignored as a huge resistance candidate in the months and even quarters ahead. That range-center area could produce months of aimless whipsaw behavior that is likely to frustrate traders to no end. In that range and environment we would advise reduced, conservative directional risk assumption. But from recent 2.50-area levels or lower, bullish exposure and policy is golden; a hugely favorable risk/reward proposition, again, until and unless threatened by a relapse below 2.575 that would warrant its cover.
These issues considered, a bullish policy and longs from 2.505 recommended in 25-Oct’s Trading Strategies Blog remain advised for long-term players with a failure below 2.575 required to threaten this call enough to warrant its cover. Shorter-term traders are advised to take profits on this exposure at-the-market (2.786) and move to a neutral/sideline position to circumvent the depths unknown of a suspected correction lower. A recovery above 2.905 negates this shorter-term call, reinstates the bull and exposes potentially sharp gains thereafter. We will be watchful for a relapse-stemming bullish divergence in short-term mo from the 2.73-to-2.70-area in the days/week ahead for what we believe will be another favorable risk/reward condition from which shorter-term traders can resurrect a bullish policy.


