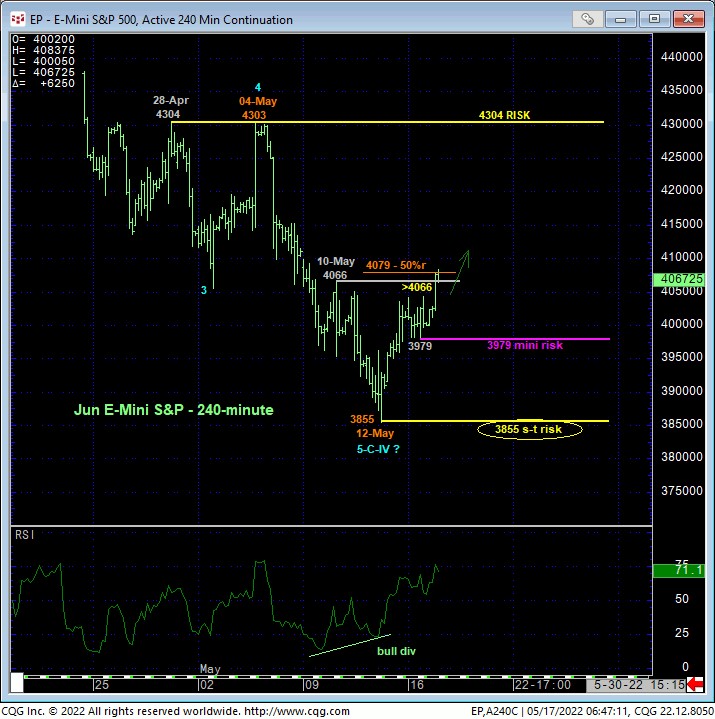
The 240-min chart below shows overnight’s recovery above 10-May’s 4066 smaller-degree corrective high that confirms a bullish divergence in short-term momentum. This short-term mo failure defines 12-May’s 3855 low as the end of the decline from 04-May’s 4303 next larger-degree corrective high, exposing at least a correction of this portion of the major bear trend. Today’s continued rebound also defines yesterday’s 3979 low as a smaller-degree corrective low the market would now be required to sustain gains above to maintain a more immediate bullish count on a smaller scale. Per such, 3979 and certainly 3855 serves as mini and short-term risk parameters from which shorter-term traders with tighter risk profiles can objectively base non-bearish decisions like short-covers and cautious bullish punts.
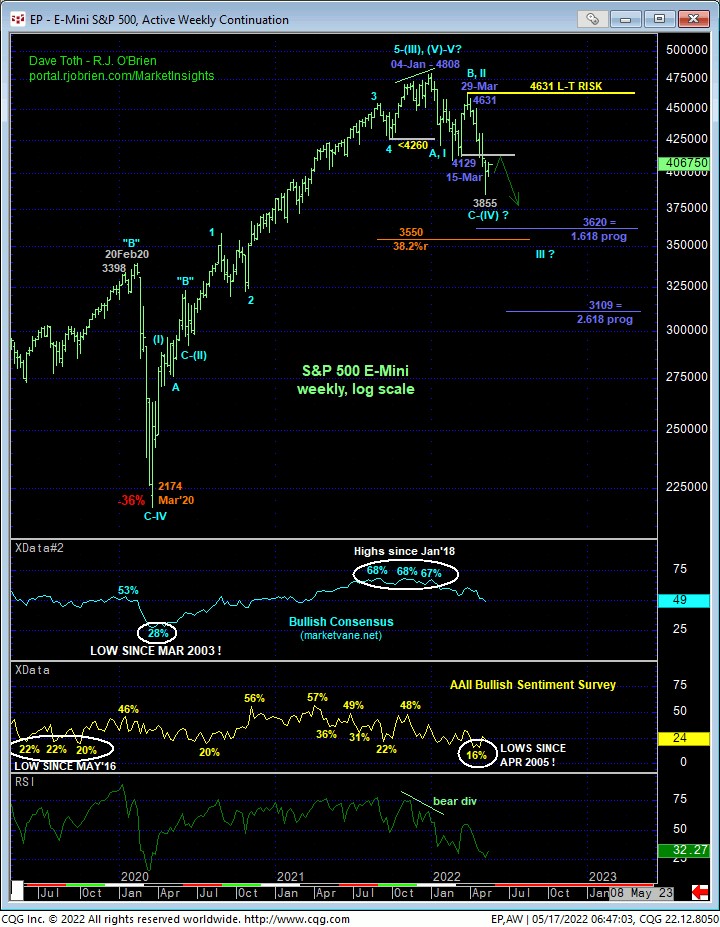
From a longer-term perspective however, only a glance at the daily (above) and weekly (below) log scale charts is needed to see that this bullish divergence in short-term momentum is of a grossly insufficient SCALE to conclude anything more than a slightly larger-degree correction within the major bear trend. Commensurately larger-degree strength above 04-May’s 4303 larger-degree corrective high remains minimally required to break even the portion of this year’s major reversal from 29-Mar’s 4631 high, let alone the entire decline from 04-Jan’s 4808 all-time high.
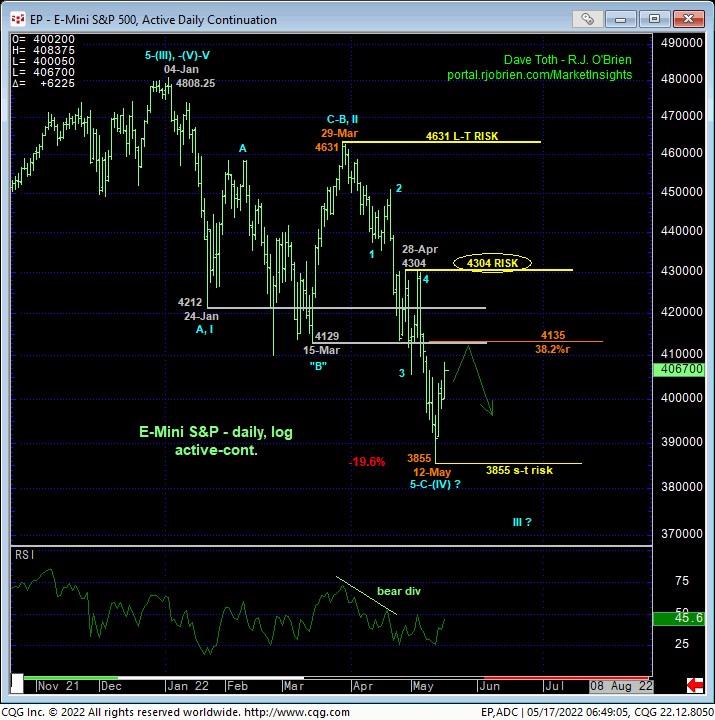
Indeed, the market remains below 3-1/2 MONTHS of former support from the 4129-to-4212-area that, since demolished earlier this month, is now considered a major resistance candidate. Also, the Fibonacci minimum 38.2% retrace of the decline from 29-Mar’s 4631 high to last week’s 3855 low neighbors this former support-turned-resistance area at 4135. A recovery attempt into the 4100-to-4200-range falls well within the bounds of just a correction within the major bear trend. Per such, 28-Apr’s 4304 corrective high remains intact as our key long-term bear risk parameter we believe this market needs to recoup to mitigate a major peak/reversal count and render the sell-off attempt from 4808 a 3-wave and thus corrective structure that might then re-expose the secular bull.
TO THIS POINT this year’s decline from 4808 to 3855 is clearly only a 3-wave affair, suggesting the possibility that the decline from 29-Mar’s 4631 high to last week’s 3855 low might be the completing C-Wave to a major BULL market correction. But until and unless this market proves commensurately larger-degree strength above at least 4304, at this juncture there’s no way to know that the decline from 4631 isn’t the dramatic 3rd-Wave of a major reversal lower that exposes quarters of downside risk ahead. A relapse below 3855 will reinforce this major bearish count while a recovery above 4304 is required to threaten it enough for even longer-term institutional players and investors to move from a currently-advised bearish policy to at least neutral.
These issues considered, shorter-term traders are advised to move to a neutral/sideline position with a relapse below 3979 resuscitating a bearish count and further weakness below 3855 confirming it. A bearish policy remains advised for longer-term institutional players and investors with a recovery above 4304 required to threaten this call enough to warrant moving to a neutral/sideline position. We will be watchful for a recovery-stemming bearish divergence in short-term momentum in the days/week ahead needed to arrest this rebound and perhaps provide an early indication of a resumption of the bear and a favorable risk/reward opportunity for shorter-term traders to re-establish bearish exposure.