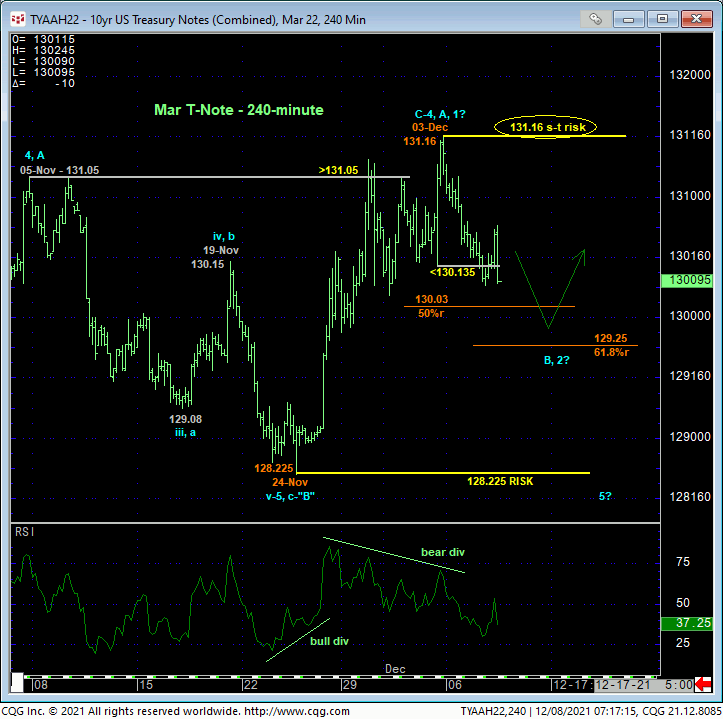
The 240-min chart below shows yesterday and overnight’s failure below last Fri’s 130.135 corrective low and short-term risk parameter discussed in Mon’s Technical Blog. This mo failure defines Fri’s 131.16 high as the end of the rally from 24-Nov’s key 128.225 low and new short-term risk parameter from which non-bullish decisions like long-covers and cautious bearish punts can now be objectively based and managed.
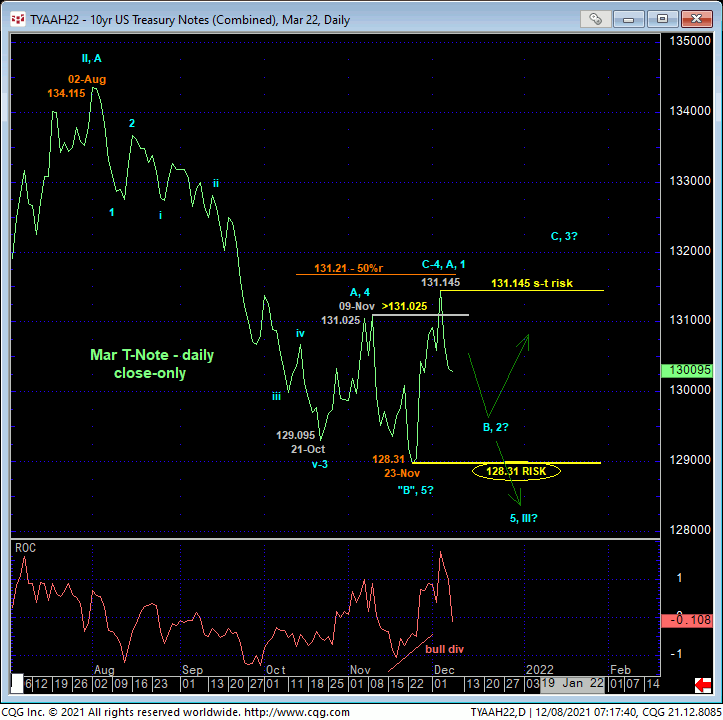
The bearish divergence in short-term momentum comes on the heels of last week’s bullish divergence in daily momentum shown in the daily close-only chart of the contract below. This divergence breaks Aug-Nov’s broader downtrend, exposing a larger-degree correction laterally-to-higher until and unless negated by a relapse below 23-Nov’s 128.31 low close or an intra-day break below 24-Nov’s 128.225 intra-day low. These levels serve as our long-term risk parameters from which non-bearish decisions like short-covers and cautious bullish punts can be objectively based and managed. In effect, it’s easy to see the borders of the past couple months’ range as the key direction flexion points heading forward.
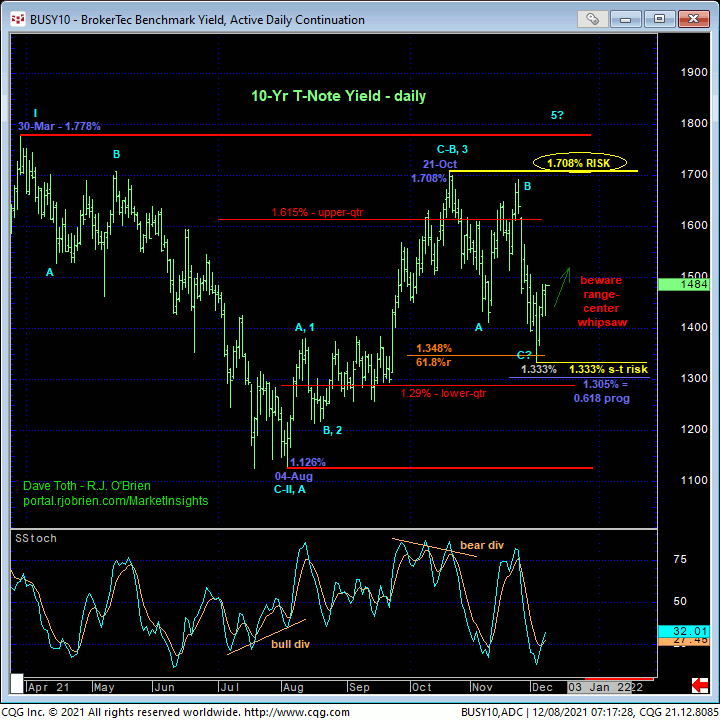
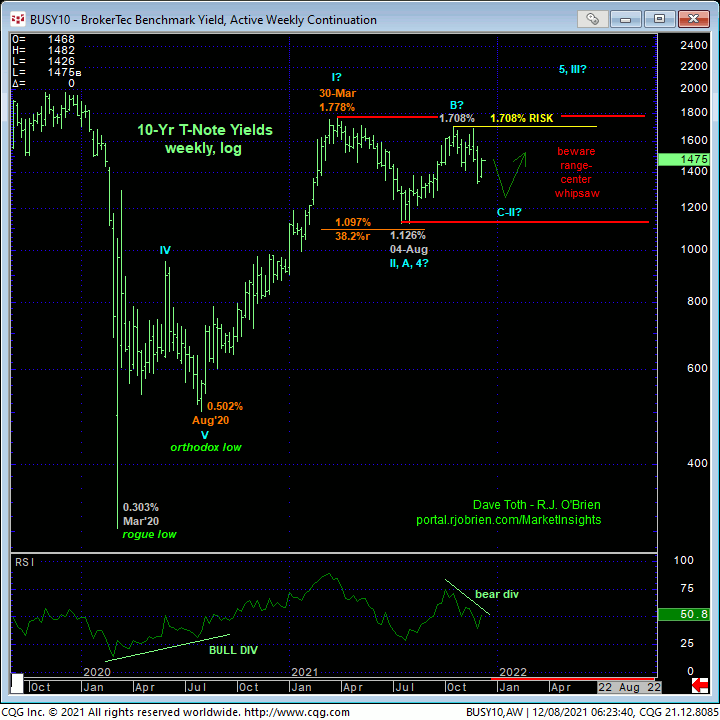
On a 10-yr yield basis, the daily chart above and weekly log chart below show the market smack in the middle of the middle-half bowels of this year’s 1.778%-to-1.126%-range where the odds of aimless whipsaw risk are approached as higher. Yesterday’s analogous recovery above Fri’s minor 1.472% corrective high breaks the recent late-Nov/early-Dec slide and defines Fri’s 1.333% low as a tight but objective risk parameter from which to base decisions calling for at least another intra-range pop in rates. But major rate resistance between 21-Oct’s 1.708% high and 30-Mar’s 1.778% high remains intact as the hurdle this market needs to eclipse to resurrect what we believe is a new secular move up in rates. In lieu of such a rate jump, further aimless, lateral-to-lower action is expected, with a relapse below 1.333% perpetuating this YEAR’S range that could then produce a run at its lower-quarter between 1.29% and 1.13%.
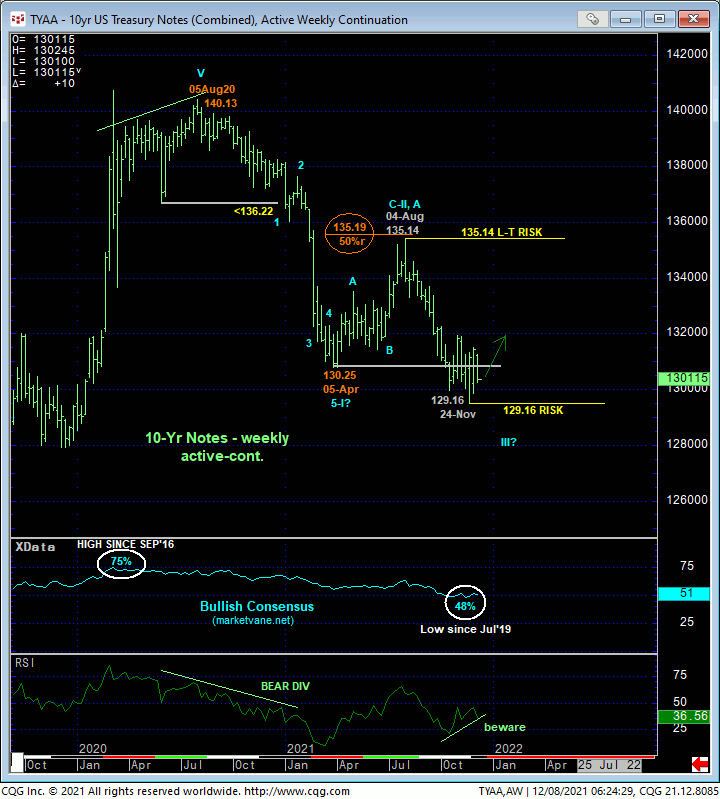
Another element that blemishes a broader bearish count in the contract are recent historically low/pessimistic levels in the Bullish Consensus (marketvane.net) measure of market sentiment shown in the weekly chart below. Along with clearly waning downside momentum, a relapse below at least 24-Nov’s 129.16 low in the then-prompt Dec contract is required to re-expose the secular bear trend. But even then, unless rates haven’t broken the major 1.708%-to-1.778%-area resistance, such new lows in the contract would have to be approached with suspicion.
These issues considered and as a result of this week’s short-term mo failure below 130.135, traders are advised to move to a neutral/sideline policy as the market’s position in the middle of key lateral range boundaries on both a contract and yield basis presents poor risk/reward metrics from which to initiate directional exposure. We will be watchful for a relapse stemming bullish divergence in short-term mo that could present a favorable risk/reward punt from the bull side.
