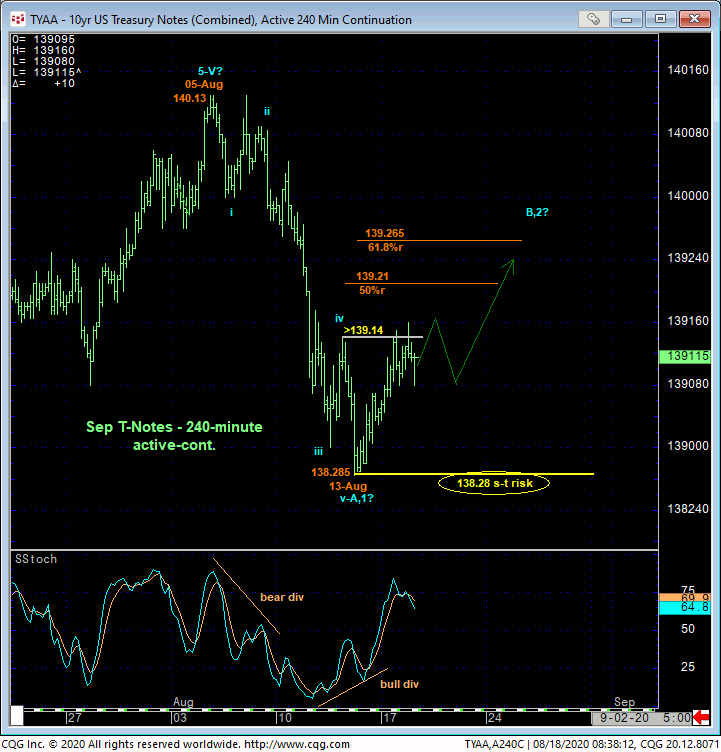
In last Fri’s Technical Blog we discussed the prospect of an interim corrective rebuttal amidst waning downside momentum and the prospect that the decline from 05-Aug’s 140.13 high looked to be a textbook 5-wave Elliott sequence as labeled in the 240-min chart below. We identified 13-Aug’s 139.14 smaller-degree (4th-wave) corrective high as the short-term risk parameter the market needed to sustain losses below to maintain a more immediate bearish count. Its failure to do so yesterday and overnight CONFIRMS the bullish divergence in momentum and defines Thur’s 138.285 low as the END to that 5-wave sequence down and our new short-term risk parameter from which non-bearish decisions like short-covers and cautious bullish punts can now be objectively based and managed.
Given the magnitude of the secular bull trend and while we have suspicions that early-Aug’s break could be the start of a major peak/reversal-threat environment, traders should not be surprised by a more extensive corrective rebuttal in terms of both price (61.8% retrace or greater) and time. As a “reference point”, we’ve marked the 61.8% retrace of Aug’s 140.13 – 138.285 decline at 139.265. This level is NOT regarded as resistance, but rather just a point of interest around which to be on the lookout for a recovery-stemming bearish divergence in momentum that, if confirmed, could provide one of the great risk/reward selling opportunities of the rest of the year. In lieu of such a requisite momentum failure on this recovery, the correction could test the extreme upper recesses of this month’s range OR this entire peak/reversal count could be flat out wrong and the secular bull returns to post new all-time highs.


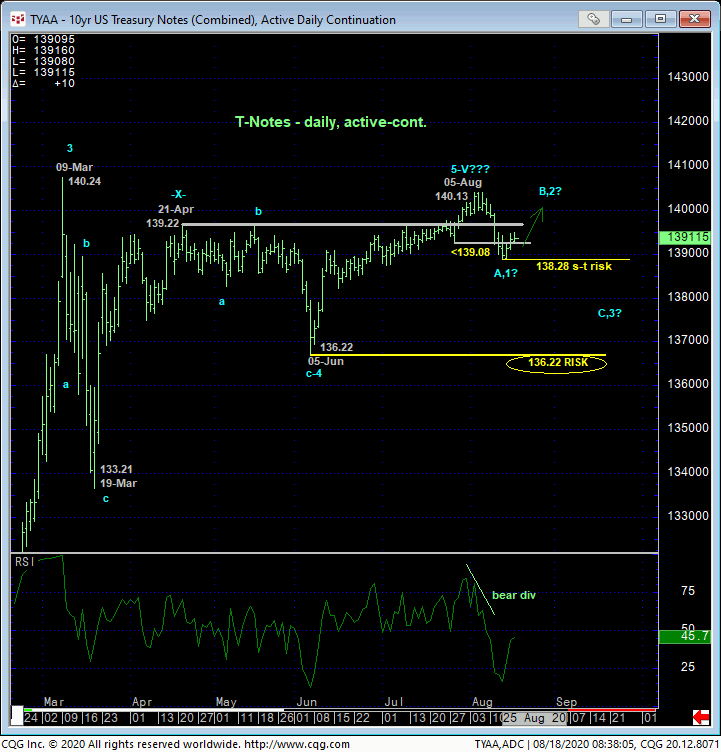
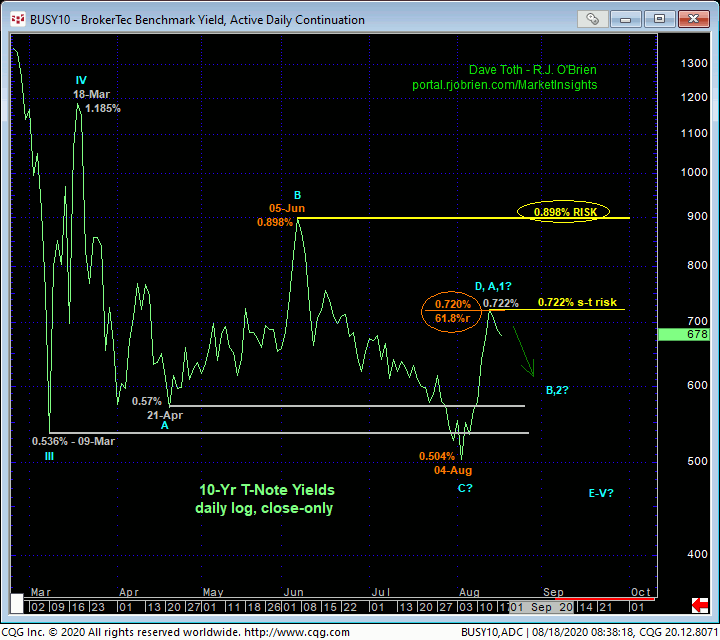
As pointed out last week, Thur’s 0.722% high close and proximity to the (0.720%) 61.8% retrace of Jun-Aug’s 0.898% – 0.504% rate decline shown in the daily 10-yr yield chart below reinforces our count calling for a corrective relapse in rates and recovery in the contract. But from a longer-term perspective, we believe the market’s failure last week to sustain a breakout above the prior THREE MONTHS’ resistance that then should have held as new support is an early warning signal of a peak/reversal threat that could be major in scope. If this count is wrong, all the bull has to do is take our 05-Aug’s 140.13 high in the contract and 04-Aug’s 0.504% low in rates. Until and unless this happens, this peak/reversal count in the contract is real and objective and has the potential to provide one of the great risk/reward selling opportunities of the year where traders may only have to incur short-term risk for a position that could morph into a massive long-term play.

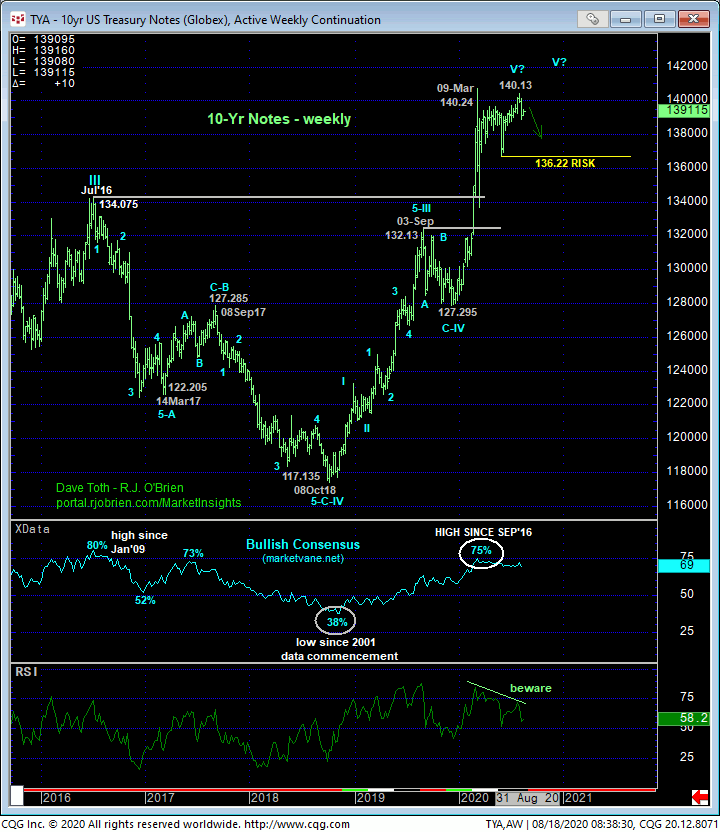
Admittedly, the peak/reversal factors cited above are of a very short-term nature thus far. And we cannot conclude a major event from piddly smaller-degree evidence. So there’s gotta be some “prospective” longer-term meat to the argument. This meat is shown in the weekly chart below and includes:
- upside momentum that’s been waning since Mar
- historically frothy sentiment this year that hasn’t been seen since that that warned of and accompanied Jul’16’s major peak/reversal
- an arguably complete 5-wave Elliott sequence that dates from Oct’18’s 117.13 low.
Granted, commensurately larger-degree weakness below 05-Jun’s 136.22 larger-degree corrective low and key long-term risk parameter remains required to, in fact, break even the uptrend from Dec’19’s 127.29 low, let alone the near-two-year bull. But as always, the reversal of 10,000 ticks starts with a single bearish divergence in intra-day momentum. And we have mapped out some rather specific requirements for reinforcing price action in the days and weeks ahead to reinforce this count or negate it, like:
- proof of 3-wave corrective behavior on a 61.8% or greater retracement stemmed by
- another confirmed bearish divergence in momentum that
- must not break 140.13.
If/when such behavior is confirmed, a bearish strategy will be advised. In the meantime, we anticipate lateral-to-higher prices that could span weeks with a relapse below 138.28 that will resurrect at least the intermediate-term downtrend and expose potentially sharp losses thereafter. Cautious bullish punts from approximately 139.04 OB are OK with a failure below 138.28 negating this call and warranting its immediate cover.


