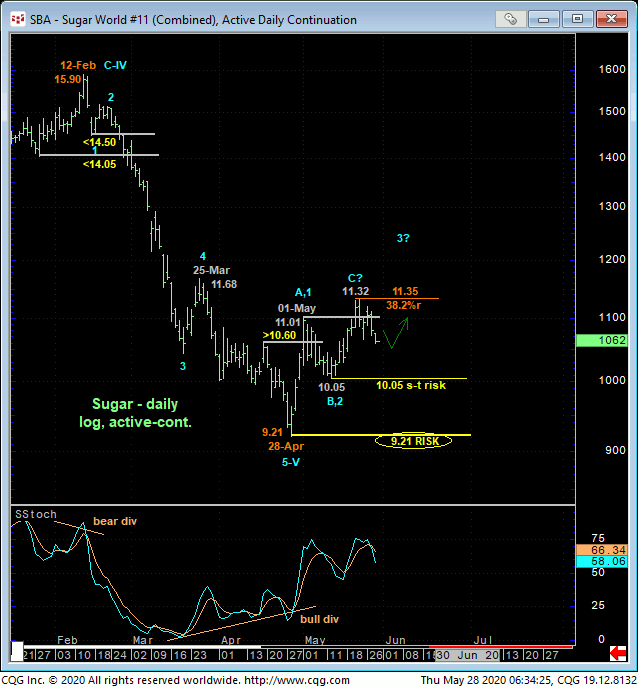
For the past month and as introduced in 30-Apr’s Technical Blog, we’ve been of the opinion that the sugar market is in a major base/reversal environment. Our bullish count was initially confirmed with 01-May’s bullish divergence in momentum that, in fact, broke Feb-Apr’s major downtrend and reinforced with 20-May’s resumed uptrend above 01-May’s 11.01 initial counter-trend high. From a longer-term perspective, this major bullish count remains intact until and unless threatened on an appropriately sized scale by a failure below at least 12-May’s 10.05 smaller-degree corrective low and our short-term risk parameter shown in the daily log scale chart below.

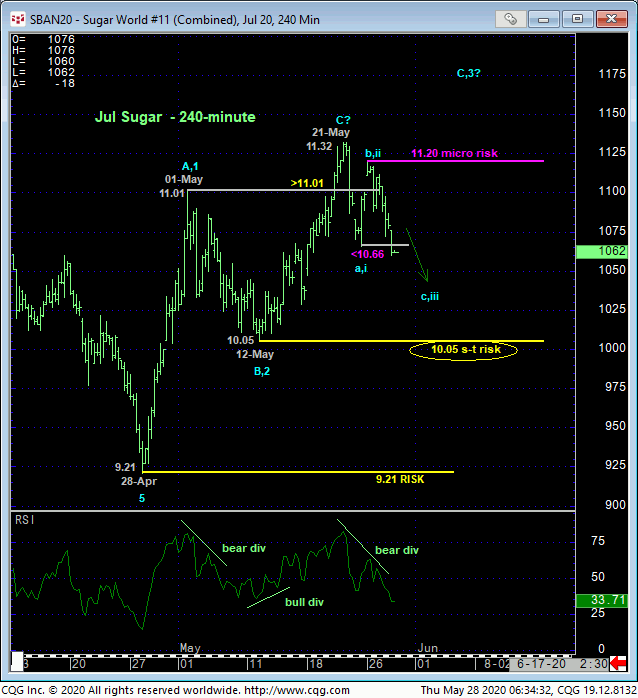
On a very short-term basis however, overnight’s relapse below Fri’s 10.66 initial counter-trend low confirms a bearish divergence in short-term momentum that confirms at least the short-term trend as down. This resumed short-term weakness leaves Tue’s 11.20 high in its wake as the latest smaller-degree corrective high the market must now recover above to render the sell-off attempt from 21-May’s 11.32 high a 3-wave and thus corrective structure consistent with our major bullish count. In this very short-term regard then, traders needing or wanting to make even interim non-bullish decisions like long-covers or cautious bearish punts can now objectively do so with a recovery above 11.20 negating this call and re-exposing the major bull.
The interesting thing about this admittedly short-term weakness is that 1) it stems from a 11.32 level that is only three ticks away from the (11.35) 38.2% retrace of Feb-Apr’s 15.90- 9.21 decline and 2) that the recovery attempt from 28-Apr’s 9.21 low is, thus far at least, only a 3-wave structure that we cannot ignore as a possible corrective event that could re-expose the secular bear trend. If we’re going to be talking about secular trends however, smaller-degree issues like today’s hiccup below 10.66 should not factor into the conversation. Commensurately larger-degree weakness below 10.05 DOES factor into discussion. Per such and from a short-to-intermediate-term perspective, we believe this market has identified 11.20 and 10.05 as the key directional triggers.


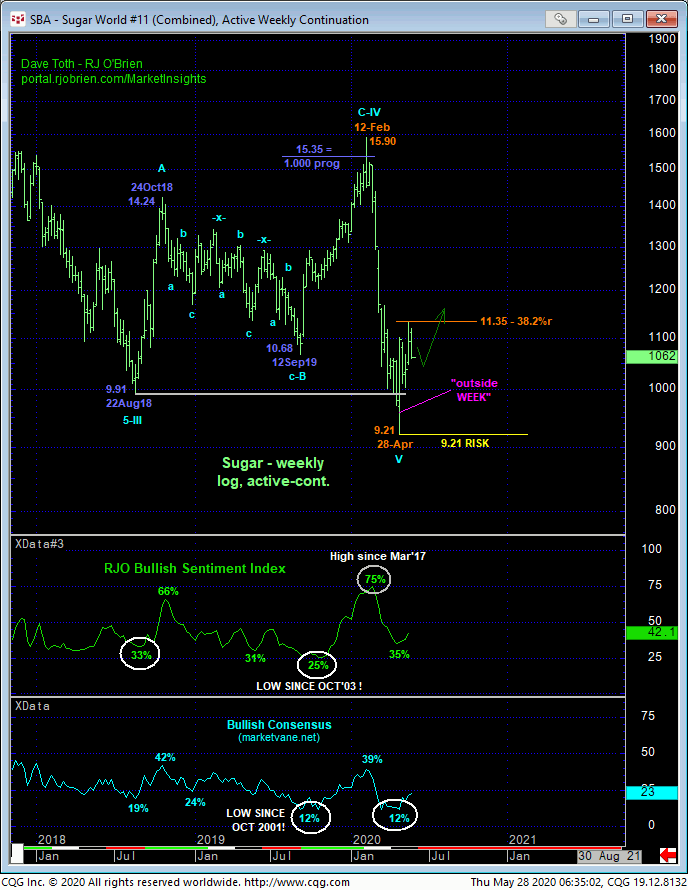
From a long-term perspective, it’s hard for the market’s rejection thus far of the (11.35) 38.2% retrace of Feb-Apr’s collapse not to jump out from the weekly log scale chart above. But this Fibonacci fact and bearish divergence in short-term momentum is NOT enough evidence to negate the still-compelling collection of facts on which our major base/reversal count is predicated:
- a confirmed bullish divergence in momentum that breaks Feb-Apr’s downtrend
- a complete 5-wave Elliott sequence from 12-Feb’s 15.90 high to 28-Apr’s 9.21 low
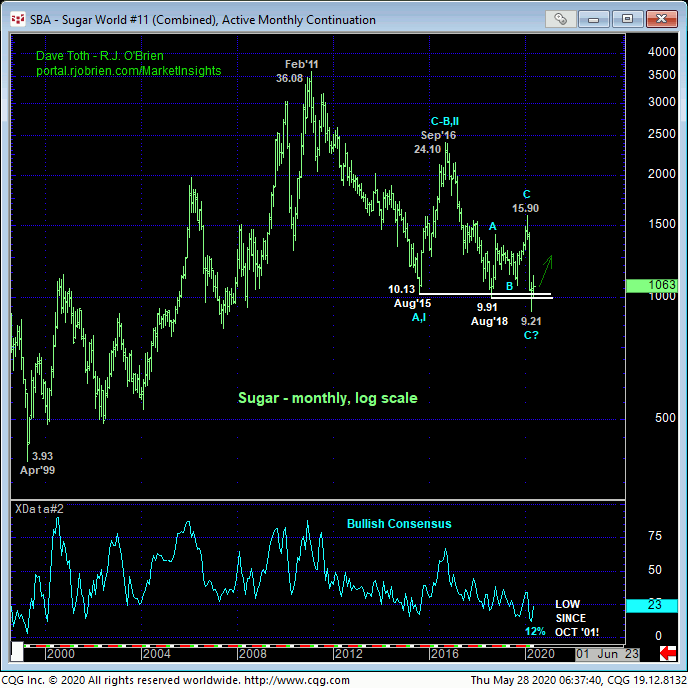
- historically bearish sentiment/contrary opinion levels
- on “outside WEEK” the week of 28-Apr’s 9.21 low
- the market’s failure, thus far at least, to sustain losses below the past FIVE YEARS’ support around the 10-cent area that, since broken, should have held as new resistance.
To even threaten these facts, let alone negate them, commensurately larger-degree weakness below at least 10.05 and preferably 28-Apr’s 9.21 low and key long-term risk parameter remains required. Today’s relapse below 10.66 is grossly insufficient for long-term players to give up on a bullish policy. Today’s sub-10.66 slip is perfectly fine for scalpers to take bearish punts with a risk to 11.20, and perhaps for longer-term players to “manage” a portion of a still-advised bullish policy in exchange for whipsaw risk above 11.20. But until and unless this market fails below at least 10.05, setback attempts like the past week’s are advised to first be approached as another corrective buying opportunity for longer-term players within a base/reversal process that we believe is still major in scope.


