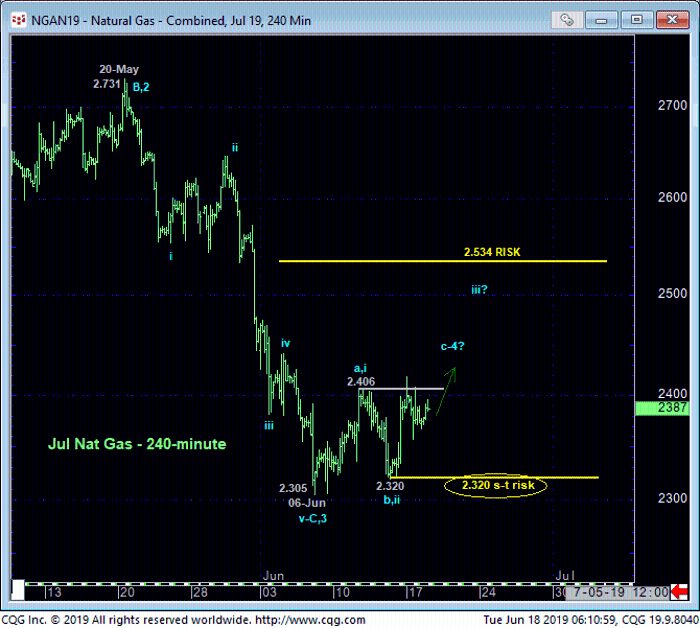
Yesterday’s recovery above 11-Jun’s 2.406 initial counter-trend high and our short-term risk parameter discussed in Fri’s Technical Blog confirms a bullish divergence in momentum that breaks the downtrend from at least 20-May’s 2.731 high and leaves Thur’s 2.320 low in its wake as the latest smaller-degree corrective low this market is now obligated to sustain gains above to maintain a larger-degree correction or reversal threat higher. IN this regard this 2.320 low serves as our new short-term risk parameter from which traders can pare or neutralize bearish exposure to circumvent the heights unknown of a correction or reversal higher.


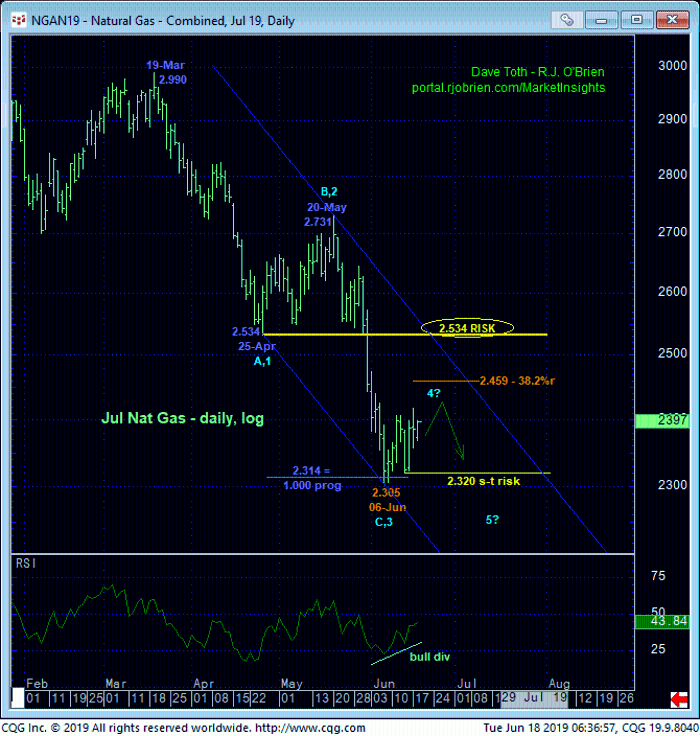
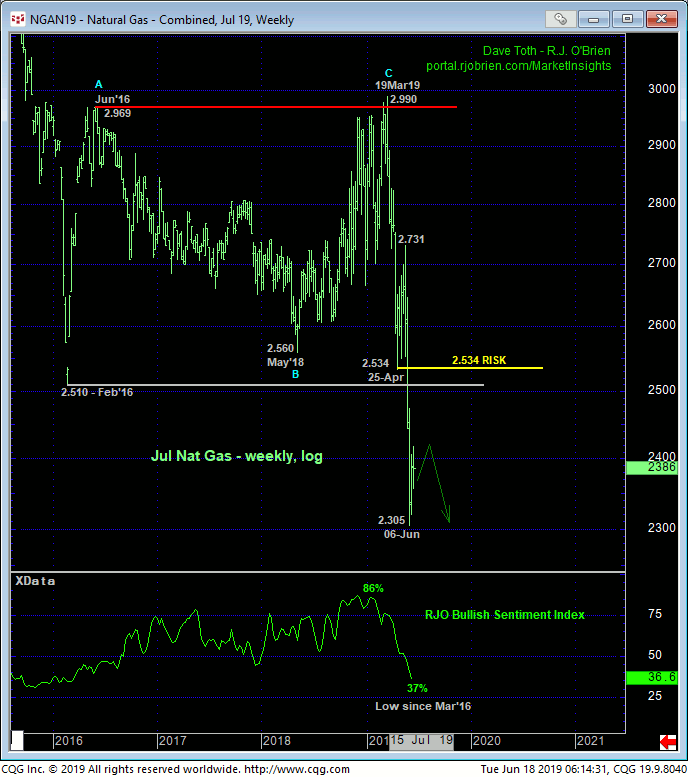
This tight but objective risk parameter at 2.320 may come in handy as the recovery attempt thus far from 06-Jun’s 2.305 remains well within the bounds of a mere (4th-Wave) correction within the still-developing and major downtrend shown in the daily (above) and weekly (below) log scale charts. To jeopardize the impulsive integrity of a broader 5-wave Elliott sequence down from 19-Mar’s 2.990 high, a recovery above 25-Apr’s 2.534 (suspected 1st-Wave) low is required. Per such this 2.534 level serves as our long-term risk parameter to a still-advised bearish policy for long-term players.
The issue of technical and trading SCALE is once again important currently as while the past couple weeks’ recovery is obviously of an insufficient scale to conclude a broader base/reversal environment, it’s not hard to find developing threats against the broader downtrend like:
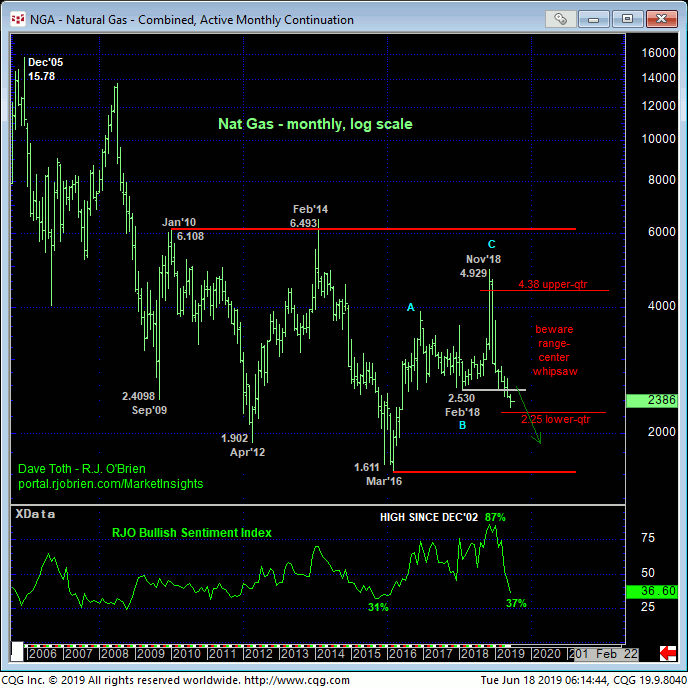
- the return to the lowest reading (37%) in our RJO Bullish Sentiment Index in over three years and
the Fibonacci fact that the decline from 20-May’s 2.731 high spanned a virtually identical length (i.e. 1.000 progression) to Mar-Apr’s preceding 2.99 – 2.534 decline.

The fact that the market has tested the (2.25) lower-quarter of the past 10-YEAR range also starts to chip away at the risk/reward merits of maintaining a longer-term bearish policy “down here”.
Simply put, if yesterday’s bullish divergence in admittedly short-term momentum is the start of something bigger to the upside, the market would be expected to start exhibiting and sustaining trendy, impulsive behavior higher. And we can now objectively gauge this behavior by the market’s ability to sustain gains above Thur’s 2.320 low and short-term risk parameter. Its failure to do so would render the recovery from 06-Jun’s 2.305 low a 3-wave and thus corrective affair and re-expose the broader bear trend.
These issues considered, shorter-term traders have been advised to move to a neutral-to-cautiously-bullish policy with a failure below 2.320 required to negate this call and resurrect the broader bear trend that would then require moving back to a cautious bearish position. Long-term players are advised to pare bearish exposure to more conservative levels and jettison the position altogether on commensurately larger-degree strength above 2.534. For longer-term players who don’t want to risk greater nominal exposure to 2.534, your option is to exchange that greater nominal risk with whipsaw risk by neutralizing bearish exposure now and resetting it on a failure below 2.320.


